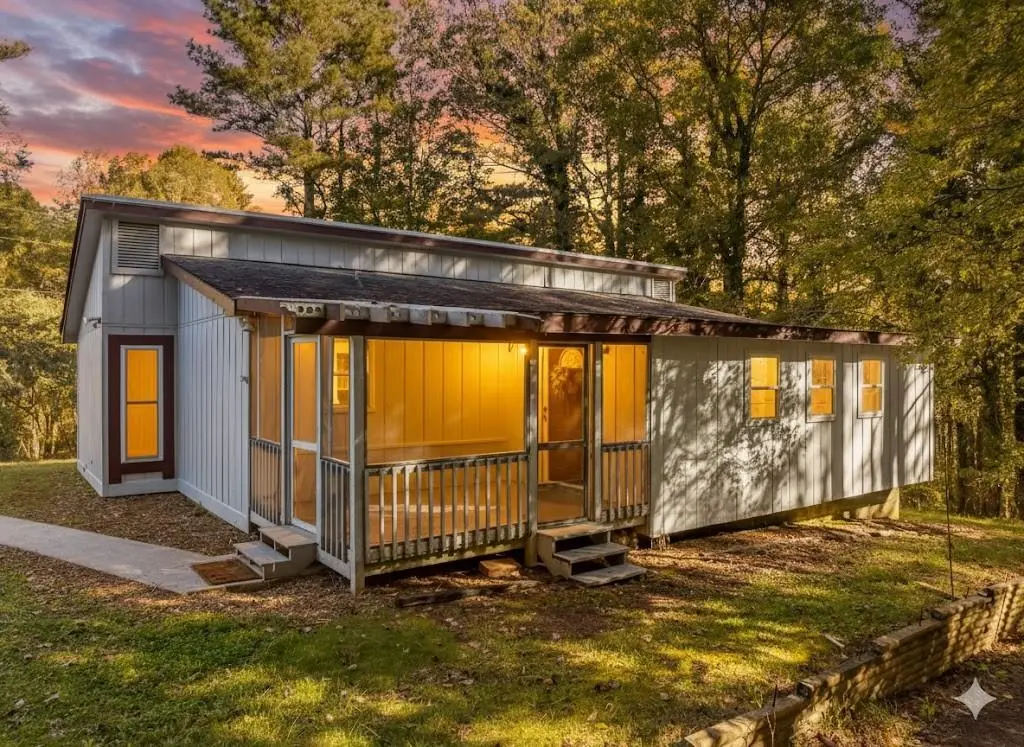
620 Wash Wilson Rd
Epworth, GA 30513
$234,900D+
3 bd · 1.0 ba ·
1,268 sqft ·
Built 1980
· SingleFamily
· Active
· 227 DOM
Cashflow @ list (25.0% down · 7.5%)
Estimated rent
$2,188/mo
Mortgage (P&I)
−$1,232
Tax + insurance
−$205
HOA
−$0
Vac / Maint / Mgmt
−$460
Net cashflow
$292/mo
Annual
$3,508/yr
Cap rate
7.79%
Cash-on-cash
5.33%
DSCR
1.24
1% rule
0.93%
Cash to close
$65,772
Investor read
- This is a 3-bed/1.0-bath single-family listed at $235k.
- At list price, monthly cash flow is $292 ($4k/yr) — positive.
- The deal already cash-flows at list — no discount required.
- To meet the 1% rule (rent ≥ 1% of price), the offer needs to be $219k (6.8% below list).
- It's been on market 227 days — a 12% lower offer ($207k) is reasonable based on typical stale-listing flexibility.
- Recommended offer: $207k (12.0% below list) — sets the bar for market timing.
- Local home prices are declining (-3.0%/yr); year-one equity from $2k of loan paydown is wiped out by about $7k of value loss. Plan a longer hold.
- Location reads 61/100 on livability (#354 in GA) — a middle-class / working-renter tenant base. Strengths: cost of living A+, crime A, employment B+; Watch: health & safety C-, schools F, amenities F.
- Fannin County (rural): math 40% / reading 39% proficiency, ranked #51 of 174 in GA (top 29%) — families likely to look elsewhere, expect single-tenant / working-renter base with shorter leases.
- Market conditions: 592 active listings in the ZIP; 3 comparable units currently listed for rent nearby; rentals at typical pace (median 24d on market — plan ~3-4 weeks tenant-placement turnaround); 375 units permitted in Fannin County in 2024 (0 in 5+ unit buildings).
- 13 sale attempts since 10y ago; this cycle's ask has dropped $45k (16%) from the opening price — seller is motivated, your offer sets the floor, not the list.
- Current owner paid $150k; list at $235k implies a 57% gain — meaningful room to come down on a strong offer.
- Climate carrying-cost: moderate wildfire risk — expect insurance premiums to compound above CPI over the hold.
- Cap rate 7.8% vs local median 1.1% in Epworth — top-decile yield for the area; either an underpriced asset or a hidden risk that comps aren't pricing in. Stress-test before assuming the spread holds.
- At $2,188/mo this rent would consume 47% of the median local household income ($56k/yr) (locally 240% of renters already pay >50% of income on rent) — very limited rent-growth headroom before tenants either downsize or default.
Questions for listing agent
- It's been on market 227 days. Have you received any prior offers? Is the seller open to a 12% concession, seller financing, or rate buy-down credit?
- Why hasn't it sold? Are there any deal-killer items the seller is aware of (foundation, flood, title, zoning, code violations)?
- Is there a deadline driving the sale (1031 exchange, divorce, estate, relocation)? That informs how much negotiation room exists.
- Schools are F-rated, which usually means shorter tenancies and higher turnover. Who's the typical renter profile here, and what's been the actual vacancy rate?
- The area grade is low — what's the realistic commute time and amenity access for the typical tenant pool here? Any planned neighborhood developments (good or bad) we should know about?
- What's the average days-on-market for RENTAL listings here right now (not sales)? A rising rental-DOM trend means longer vacancies and softer asking-rent achievability than the comps imply.
- What's the recent tenant-quality profile in this submarket — average credit score on applications, eviction rate, late-payment / NSF rate, and stable-employment percentage? A property-management company in the area should have these aggregated.
- How much new for-sale + rental construction is in the pipeline within 1–3 miles? Heavy new supply typically softens prices + rents 12–24 months out; constrained supply supports both.
CashFlowRE · CFR-XYFTGE08TPPFFT
· Data 2 days ago
cashflowre.app · 2026-05-29