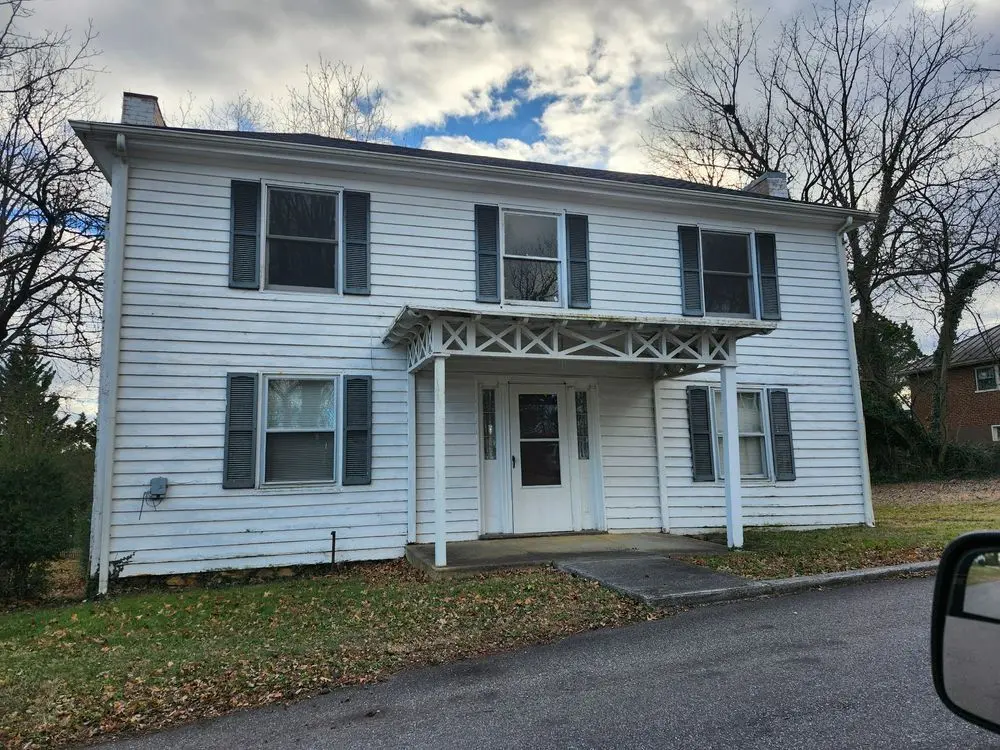
512 Lee St
Bedford, VA 24523
$166,000D+
2 bd · 2.0 ba ·
1,400 sqft ·
Built —
· SingleFamily
· Active
· 154 DOM
Cashflow @ list (25.0% down · 7.5%)
Estimated rent
$1,431/mo
Mortgage (P&I)
−$871
Tax + insurance
−$277
HOA
−$0
Vac / Maint / Mgmt
−$300
Net cashflow
$-17/mo
Annual
$-203/yr
Cap rate
6.17%
Cash-on-cash
-0.44%
DSCR
0.98
1% rule
0.86%
Cash to close
$46,480
Investor read
- This is a 2-bed/2.0-bath single-family listed at $166k.
- At list price, monthly cash flow is $-17 ($-203/yr) — negative.
- To cash-flow at today's rent, offer at most $164k (1.5% below list).
- To meet the 1% rule (rent ≥ 1% of price), the offer needs to be $143k (13.8% below list).
- It's been on market 154 days — a 12% lower offer ($146k) is reasonable based on typical stale-listing flexibility.
- Recommended offer: $143k (13.8% below list) — sets the bar for 1% rule.
- Local home prices are declining (-3.0%/yr); year-one equity from $1k of loan paydown is wiped out by about $5k of value loss. Plan a longer hold.
- Location reads 74/100 on livability (#137 in VA, #4,371 nationally) — a middle-class / working-renter tenant base. Strengths: cost of living A+, health & safety A+, housing A-; Watch: amenities F, commute F, employment D-.
- Bedford County Public School District (rural): math 55% / reading 73% proficiency, ranked #41 of 131 in VA (top 31%) — acceptable for families but not a draw, mixed tenant base, ~2y average lease.
- Zoned schools: Bedford Elementary (math 47% / reading 52%, grade D, #742 of 1,108 statewide, top 70%, 431 students, 85% FRL); Liberty Middle (math 49% / reading 67%, grade B, #174 of 342 statewide, top 51%, 535 students, 86% FRL); Liberty High (math 41% / reading 68%, grade C-, #281 of 319 statewide, top 90%, 726 students, 69% FRL) — zoned schools average 80% FRL vs 30% district-wide (50 pts higher); higher-poverty schools than district average — tighter screening recommended.
- Market conditions: 239 active listings in the ZIP; 4 comparable units currently listed for rent nearby; rentals at typical pace (median 23d on market — plan ~3-4 weeks tenant-placement turnaround); 294 units permitted in Bedford County in 2024 (0 in 5+ unit buildings).
- Bedford County population projected at +8% by 2050 — modest demand growth; plan on rents tracking national, not racing it.
- Climate carrying-cost: extreme-heat days projected 7→18/yr by 2055 (HVAC capex compounding) — expect insurance premiums to compound above CPI over the hold.
- Cap rate 6.2% vs local median 3.2% in Bedford — top-decile yield for the area; either an underpriced asset or a hidden risk that comps aren't pricing in. Stress-test before assuming the spread holds.
Questions for listing agent
- What do current leases actually rent for vs. the listed asking? Can we see a recent rent roll and the last 12 months of T-12 income?
- It's been on market 154 days. Have you received any prior offers? Is the seller open to a 14% concession, seller financing, or rate buy-down credit?
- Why hasn't it sold? Are there any deal-killer items the seller is aware of (foundation, flood, title, zoning, code violations)?
- Is there a deadline driving the sale (1031 exchange, divorce, estate, relocation)? That informs how much negotiation room exists.
- Schools are B-rated — typically a magnet for longer-tenancy family renters. What's the average tenant stay here, and is there a school-zone premium baked into asking?
- The area grade is low — what's the realistic commute time and amenity access for the typical tenant pool here? Any planned neighborhood developments (good or bad) we should know about?
- What's the average days-on-market for RENTAL listings here right now (not sales)? A rising rental-DOM trend means longer vacancies and softer asking-rent achievability than the comps imply.
- What's the recent tenant-quality profile in this submarket — average credit score on applications, eviction rate, late-payment / NSF rate, and stable-employment percentage? A property-management company in the area should have these aggregated.
CashFlowRE · CFR-Y0EJHH5M6G2BNT
· Data 2 weeks ago
cashflowre.app · 2026-05-29