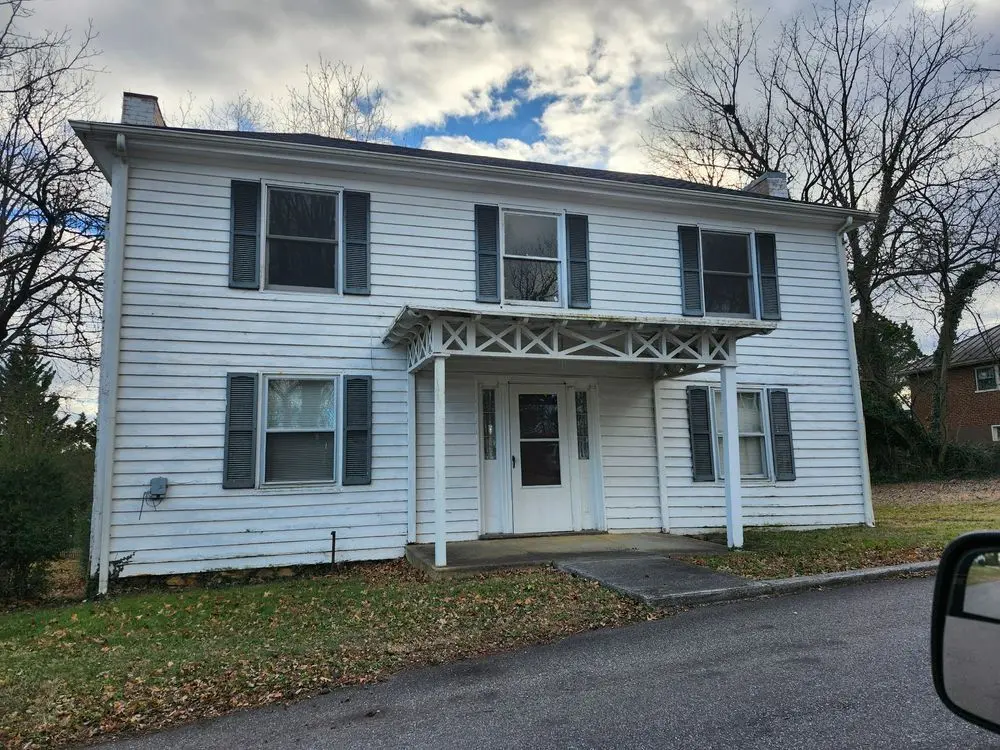
512 Lee St · Bedford, VA
Flood risk 1/10 · Minimal
- FEMA flood zone
- X (unshaded)
- Chance of flooding over 30 yrs
- 0.0%
- Est. flood insurance / yr
- $507 – $1,088
Fire risk 4/10 · Minor
- Est. fire insurance / yr
- $666 – $1,236
Heat risk 5/10 · Moderate
- Hot days now (above 101°F)
- 7 days/yr
- Hot days in 30 yrs
- 18 days/yr
Wind risk 2/10 · Minimal
- Chance of severe wind over 30 yrs
- 2.0%
Air-quality risk 2/10 · Minimal
- Unhealthy air days now
- 1 days/yr
- Unhealthy air days in 30 yrs
- 1 days/yr
Risk factors via First Street. Map © Google.
Why this score? — see what drove the D+ grade
The composite is a weighted blend of 9 inputs, each scored 0–100. Each bar is that input's sub-score; the figure is the points it added to the 100-point composite (weight × sub-score).
- ARV discount +15.0/15.0
- Cash flow +12.7/30.0
- Schools +5.5/10.0
- DSCR +3.8/10.0
- Livability +3.7/5.0
- 1% rule +3.6/10.0
- Rent growth +2.5/5.0
- Condition / age +2.5/5.0
- Appreciation +0.0/10.0
$166,000
🖨 Deal sheet (PDF) 📄 Offer letter ✓ Due diligence
Listing remarks MLS
Duplex fixer upper for sale. Home is being sold as is. New roof 2 yrs ago. Large lot. Great location and neighborhood.
Key facts
- Large lot
- New roof
- Listed 154 days
Tags
Neighborhood map
What this means for you Summary
Snapshot
- This is a 2-bed/2.0-bath single-family listed at $166k.
Deal economics
- At list price, monthly cash flow is $-17 ($-203/yr) — negative.
- To cash-flow at today's rent, offer at most $164k (1.5% below list).
- To meet the 1% rule (rent ≥ 1% of price), the offer needs to be $143k (13.8% below list).
- Recommended offer: $143k (13.8% below list) — sets the bar for 1% rule.
- Cap rate 6.2% vs local median 3.2% in Bedford — top-decile yield for the area; either an underpriced asset or a hidden risk that comps aren't pricing in. Stress-test before assuming the spread holds.
Location & tenants
- Location reads 74/100 on livability (#137 in VA, #4,371 nationally) — a middle-class / working-renter tenant base. Strengths: cost of living A+, health & safety A+, housing A-; Watch: amenities F, commute F, employment D-.
- Bedford County Public School District (rural): math 55% / reading 73% proficiency, ranked #41 of 131 in VA (top 31%) — acceptable for families but not a draw, mixed tenant base, ~2y average lease.
- Market conditions: 238 active listings in the ZIP; 4 comparable units currently listed for rent nearby; rentals at typical pace (median 23d on market — plan ~3-4 weeks tenant-placement turnaround); 294 units permitted in Bedford County in 2024 (0 in 5+ unit buildings).
Forward outlook
- Local home prices are declining (-3.0%/yr); year-one equity from $1k of loan paydown is wiped out by about $5k of value loss. Plan a longer hold.
- Bedford County population projected at +8% by 2050 — modest demand growth; plan on rents tracking national, not racing it.
Negotiation context
- It's been on market 154 days — a 12% lower offer ($146k) is reasonable based on typical stale-listing flexibility.
Risks & watch-outs
- Climate carrying-cost: extreme-heat days projected 7→18/yr by 2055 (HVAC capex compounding) — expect insurance premiums to compound above CPI over the hold.
Questions for the listing agent
- What do current leases actually rent for vs. the listed asking? Can we see a recent rent roll and the last 12 months of T-12 income?
- It's been on market 154 days. Have you received any prior offers? Is the seller open to a 14% concession, seller financing, or rate buy-down credit?
- Why hasn't it sold? Are there any deal-killer items the seller is aware of (foundation, flood, title, zoning, code violations)?
- Is there a deadline driving the sale (1031 exchange, divorce, estate, relocation)? That informs how much negotiation room exists.
- Schools are B-rated — typically a magnet for longer-tenancy family renters. What's the average tenant stay here, and is there a school-zone premium baked into asking?
- The area grade is low — what's the realistic commute time and amenity access for the typical tenant pool here? Any planned neighborhood developments (good or bad) we should know about?
- What's the average days-on-market for RENTAL listings here right now (not sales)? A rising rental-DOM trend means longer vacancies and softer asking-rent achievability than the comps imply.
- What's the recent tenant-quality profile in this submarket — average credit score on applications, eviction rate, late-payment / NSF rate, and stable-employment percentage? A property-management company in the area should have these aggregated.
- How much new for-sale + rental construction is in the pipeline within 1–3 miles? Heavy new supply typically softens prices + rents 12–24 months out; constrained supply supports both.
Investment metrics
- 1% rule
- 0.86% ✗
- Cap rate
- 6.17%
- Cash-on-cash
- -0.44%
- DSCR
- 0.98
- GRM
- 9.7
CMA / ARV
- ARV (median comp)
- $216,403
- List price
- $166,000
- Delta
- -23.29%
- Verdict
- UNDERPRICED
- Comps
- 20 within 1.0 mi
Show comp detail 11 sales within ~0.75 mi
| Address | Dist | Beds/Ba | Sqft | Sold | Price | $/sf | Match |
|---|---|---|---|---|---|---|---|
| 421 Lee St | 0.07mi | 2/2.0 | 1,300 (-7%) | 8mo | $265,000 | $204 | 78 |
| 2 Aubrey Dr | 0.31mi | 3/2.0 (+1) | 1,403 (+0%) | 4mo | $380,900 | $271 | 77 |
| 809 Grove St | 0.05mi | 3/1.0 (+1) | 1,508 (+8%) | 8mo | $190,000 | $126 | 69 |
| 617 F St | 0.19mi | 3/1.0 (+1) | 1,417 (+1%) | 18mo | $77,000 | $54 | 65 |
| 905 Judd St | 0.29mi | 3/1.0 (+1) | 1,381 (-1%) | 13mo | $218,000 | $158 | 65 |
| 1013 Madison St | 0.22mi | 3/2.0 (+1) | 1,200 (-14%) | 8mo | $215,000 | $179 | 54 |
| 621 South St | 0.63mi | 3/2.0 (+1) | 1,365 (-2%) | 9mo | $289,900 | $212 | 54 |
| 1217 Oakwood St | 0.51mi | 3/2.0 (+1) | 1,507 (+8%) | 12mo | $230,000 | $153 | 48 |
| 322 South St | 0.41mi | 2/1.0 | 1,204 (-14%) | 9mo | $211,500 | $176 | 46 |
| 625 South St | 0.64mi | 3/2.0 (+1) | 1,520 (+9%) | 11mo | $306,650 | $202 | 42 |
| 909 Morgan St | 0.68mi | 3/2.0 (+1) | 1,200 (-14%) | 5mo | $253,400 | $211 | 35 |
Match score weights: distance 35% · size 25% · config 20% · recency 20%. Top-matched comps best support the ARV.
Projected returns pro-forma
-3.0% appreciation · 3.0% rent growth · sell at horizon
- IRR
- -17.0%
- Equity multiple
- 0.40×
- Total profit
- $-27,956
- Equity at exit
- $24,751
- IRR
- -8.9%
- Equity multiple
- 0.45×
- Total profit
- $-25,645
- Equity at exit
- $14,353
Cash invested: $46,480 (down + closing). Projections, not guarantees.
Landlord ↔ Tenant lean methodology
- Overall (STATE)
- 55 Moderately Landlord-Leaning
- State Virginia
- 55 Moderately Landlord-Leaning · D+2
- County
- — inherits STATE
- City
- — inherits STATE
ZIP-level market 24523
- Home prices YoY
- -31.0%
- Active inventory
- 238
- Price-to-rent
- 9.7×
Monthly cashflow live
- Estimated rent
- $1,431 medium interval (Pro) →
- Mortgage (P&I)
- −$871
- Tax est. 1.5%
- −$208 /mo · $2,490/yr
- Insurance
- −$69
- HOA
- −$0
- Vacancy / Maint / Mgmt
- −$300
- Net cashflow
- $-17
Break-even live
Sensitivity live
| Price | -10% $98 | -5% $40 | +0% $-17 | +5% $-74 | +10% $-132 |
|---|---|---|---|---|---|
| Rent | -10% $-130 | -5% $-73 | +0% $-17 | +5% $40 | +10% $96 |
| Rate | -1.0pp $67 | -0.5pp $25 | base $-17 | +0.5pp $-60 | +1.0pp $-104 |
UW: 25.0% down · 7.5% · 30yr · 1.5% tax · 5.0% vac · 8.0% maint · 8.0% mgmt
Financing live
Cash to close
- Down payment
- $41,500
- Closing costs
- $4,980
- Reserves months
- —
- Total cash needed
- —
Loan-product check · same deal, 3 products live
Conventional
25% down · 7.5% · 30yr
- Down + closing
- —
- Monthly P&I
- —
- Monthly cashflow
- —
- DSCR
- —
- Eligible?
- —
Personal DTI + credit; lowest rate.
DSCR
20% down · 8.5% · 30yr
- Down + closing
- —
- Monthly P&I
- —
- Monthly cashflow
- —
- DSCR
- —
- Eligible?
- —
No personal income docs; deal must DSCR.
Hard money
10% down · 12.0% · 12mo
- Down + closing
- —
- Monthly P&I
- —
- Monthly cashflow
- —
- DSCR
- —
- Eligible?
- —
Short-term bridge; refi at stabilization.
Rent comps 4 comps
| Address | Beds | Baths | Sqft | Rent | $/sqft | DOM | Units | Dist |
|---|---|---|---|---|---|---|---|---|
| 620 Railroad Ave Unit 211 Bedford, VA | 2.0 | 1.0 | 967 | $1,225 | $1.27 | 22d | 1 | 0.20mi |
| 603 2nd St Unit 6 Bedford, VA | 2.0 | 1.0 | 925 | $1,300 | $1.41 | 22d | 1 | 0.39mi |
| 157 Villa Oak Cir Bedford, VA | 2.0 | 2.0 | 1550 | $1,975 | $1.27 | 45d | 1 | 1.20mi |
| 175 Villa Oak Cir Bedford, VA | 2.0 | 2.0 | 1550 | $2,150 | $1.39 | 14d | 1 | 1.25mi |
Listing history 6 events
-
2026-06-03days on market $166,000 Active 154 DOM
-
2026-06-02days on market $166,000 Active 153 DOM
-
2026-06-01days on market $166,000 Active 152 DOM
-
2026-05-31days on market $166,000 Active 151 DOM
-
2026-05-30days on market $166,000 Active 150 DOM
-
2025-12-31$166,000 Active 118-char remark
Show marketing remark (118 chars)
Duplex fixer upper for sale. Home is being sold as is. New roof 2 yrs ago. Large lot. Great location and neighborhood.
ⓘ Source: listings_history table (triggers on properties + properties_extension) + one-shot
backfill from property_details.listing_events for pre-trigger history.
Climate risk First Street
- Flood 1/10 Low FEMA zone X (unshaded) · 0% chance over 30 yrs
- Wildfire 4/10 Moderate
- Heat 5/10 Major 7 d/yr ≥101°F today · 18 d/yr by 30 yrs out
- Wind 2/10 Low 2% chance of damaging wind over 30 yrs
- Air quality 2/10 Low 1 unhealthy d/yr today · 1 by 30 yrs out
Nearby sold comps map
Loading sold comps map…
Walkable amenities ~0.75 mi
Loading nearby amenities…
Taxation est. · year 1
- Rental income
- $17,168
- − Mortgage interest
- −$9,299
- − Property taxes
- −$2,490
- − Insurance
- −$830
- − Repairs & maintenance
- −$1,373
- − Management
- −$1,373
- − Depreciation
- −$4,829
- Taxable loss
- −$3,026
- Est. tax savings @ 24.0%
- +$726
- After-tax cash flow
- $523/yr
For passive investors: Depreciation is non-cash, so a rental often shows a tax loss while cash-flowing — sheltering income. Rental losses are passive: they offset passive income freely, and up to $25,000/yr can offset ordinary (W-2) income if you actively participate and your MAGI is under $100k (phasing out to $0 by $150k); unused losses carry forward. On sale, claimed depreciation is recaptured at up to 25%, and gains may owe capital-gains tax (a 1031 exchange can defer both). Figures are a year-1 estimate at your 24.0% rate — not tax advice; consult a CPA.
Schools (NCES district)
- District
- Bedford County Public School District
- NCES district ID
- 5100360
- Math proficiency
- 55% ▼ -29.00%
- Reading proficiency
- 73% ▼ -7.00%
- Median HH income
- $56,288
- Composite
- 54.92/100
- National rank
- #1310
- State rank
- #41 of 131 in VA
Livability — Bedford
- Score
- 74/100
- State rank
- #137
- US rank
- #4371
Category grades
Schools grade is shown separately in the Schools card above.
Census & demographics
- Census place
- Bedford, VA
- City population
- 21,447
- Population (ZIP)
- 21,447
Population outlook (Bedford County) Hauer SSP2
- Today (2025)
- 83,194 people
- By 2030
- 85,499 · +2.8%
- By 2040
- 88,834 · +6.8%
- By 2050
- 90,060 · +8.3%
- By 2075
- 94,131 · +13.1%
- By 2100
- 89,832 · +8.0%
Race, ethnicity, and origin ACS 2023
- Neighborhood character
- Predominantly White (82%)
- Race & ethnicity
- White 82% Black 10% Two or more races 5% Hispanic / Latino 2%
- Common ancestry
- Slovak 3% Romanian 2% Serbian 2%
- Foreign-born
- 2% · Canada
- Languages at home
- 97% English-only · Spanish 2% French/Haitian/Cajun 1% Other Asian/Pacific 0%
Political lean MEDSL · Bedford
- 2024 margin
- Solid R (+50.4) · D 24.4% · R 74.8%
- 2008→2024 swing
- -13.0pp toward R · 2008: -37.4pp · 2024: -50.4pp
- All cycles
- 2024: R+50.4 2020: R+48.1 2016: R+49.4 2012: R+45.0 2008: R+37.4
Not yet ingested
- Civics
- —
Market trends
- HPI YoY
- ▼ -118.68%
- Current HPI
- 263.7765
- Rent YoY
- —
- Metro
- —
- State GDP YoY
- ▲ 2.40%
- F500 in state
- 50
Industry mix (Fortune 500 HQ in VA)
| Industry | F500 HQs | Revenue |
|---|---|---|
| Aerospace / Defense | 4 | $236B |
|
||
| Technology / Defense | 3 | $32B |
|
||
| Financial Services | 2 | $176B |
|
||
| Utilities | 2 | $27B |
|
||
| Insurance | 2 | $25B |
|
||
| Technology | 2 | $15B |
|
||
Price history
1 event — show timeline
- 2025-12-31 Listed $166,000 ForSaleByOwner.com
Property tax history
+0.5%/yrLatest (2021): $318 · +0.0% YoY. Source: county tax records.
Cash-flow waterfall
monthlySold comps — $/sqft
last 12 mo · ≤1 miLoading sold comps…