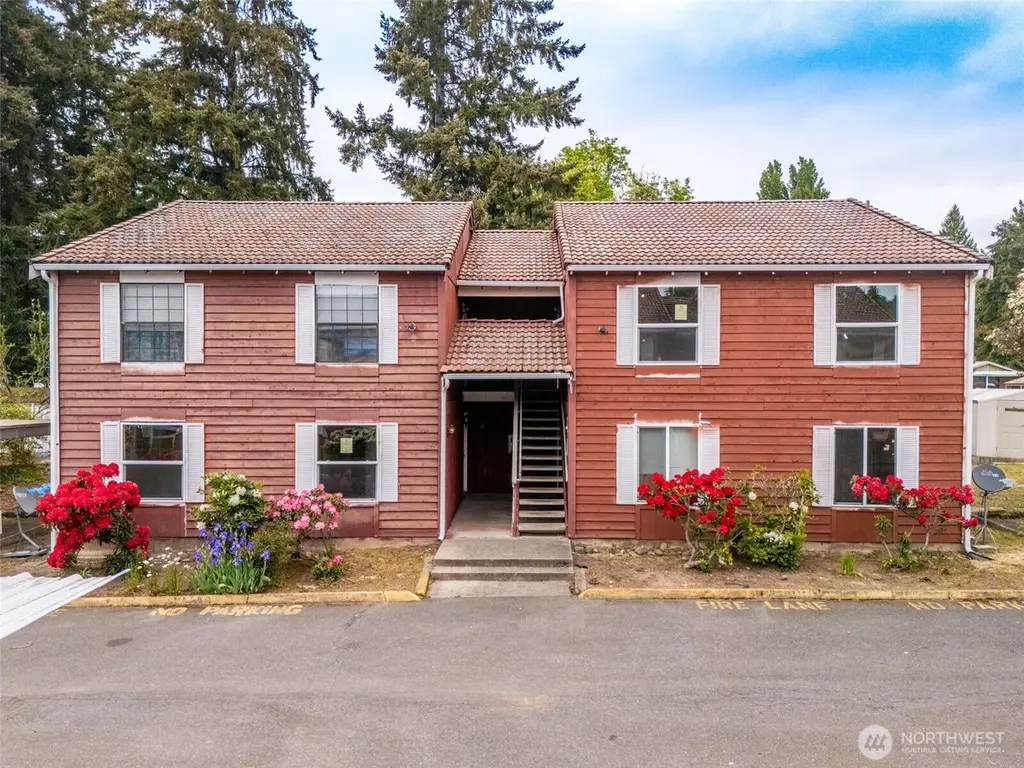
3714 D St SE
Auburn, WA 98801
$1,800,000B-
24 bd · 18.0 ba ·
12,792 sqft ·
Built 1985
· MultiFamily
· Pending
· 14 DOM
Cashflow @ list (25.0% down · 7.5%)
Estimated rent
$22,377/mo
Mortgage (P&I)
−$9,439
Tax + insurance
−$2,976
HOA
−$0
Vac / Maint / Mgmt
−$4,699
Net cashflow
$5,263/mo
Annual
$63,153/yr
Cap rate
9.80%
Cash-on-cash
12.53%
DSCR
1.56
1% rule
1.24%
Cash to close
$504,000
Investor read
- This is a 12 × 2.0-bed/1.5-bath units multifamily listed at $1.80M.
- At list price, monthly cash flow is $5k ($63k/yr) — positive. Per door: $439/mo.
- The deal already cash-flows at list — no discount required.
- Meets the 1% rule at list price ($22k rent vs $1.80M).
- Only 14 days on market — expect competitive offers; lowballing is unlikely to land.
- Local home prices are declining (-3.0%/yr); year-one equity from $12k of loan paydown is wiped out by about $54k of value loss. Plan a longer hold.
- Location reads 81/100 on livability (#75 in WA, #1,371 nationally) — a professional / high-income tenant draw. Strengths: amenities A+, commute A+, employment A+; Watch: crime F, cost of living F.
- Auburn School District (urban): math 47% / reading 56% proficiency, ranked #125 of 291 in WA (top 43%) — acceptable for families but not a draw, mixed tenant base, ~2y average lease.
- Zoned schools: Gildo Rey Elementary School (412 students, 76% FRL); Auburn Riverside High School (1,909 students, 50% FRL) — zoned schools average 63% FRL vs 44% district-wide (19 pts higher); higher-poverty schools than district average — tighter screening recommended.
- Market conditions: Rents flat; 326 active listings in the ZIP; solid renter incomes; 10,555 units permitted in King County in 2024 (7,119 in 5+ unit buildings).
- King County population projected at +44% by 2050 — long-run rental-demand tailwind backs the buy-and-hold thesis.
- 2 sale attempts since 26y ago with the ask held roughly flat each time — persistent listings suggest the price (not the market) is what's stuck; bring a comps-based counter.
- Current owner paid $767k; list at $1.80M implies a 135% gain — meaningful room to come down on a strong offer.
- Cap rate 9.8% vs local median 2.7% in Auburn — top-decile yield for the area; either an underpriced asset or a hidden risk that comps aren't pricing in. Stress-test before assuming the spread holds.
- At $22,377/mo this rent would consume 330% of the median local household income ($81k/yr) (locally 1278% of renters already pay >50% of income on rent) — very limited rent-growth headroom before tenants either downsize or default.
Questions for listing agent
- Can we see the unit-by-unit rent roll, current vacancy, and any below-market leases? What's the average tenancy length?
- What capital expenditures (roof, boiler, parking lot, exteriors) have been made in the last 5 years, and what's planned in the next 2?
- Is there a deadline driving the sale (1031 exchange, divorce, estate, relocation)? That informs how much negotiation room exists.
- Crime grade is F in this area — have there been break-ins, vandalism, or insurance claims at this property in the last 3 years? What carrier currently insures it and at what premium?
- What's the average days-on-market for RENTAL listings here right now (not sales)? A rising rental-DOM trend means longer vacancies and softer asking-rent achievability than the comps imply.
- What's the recent tenant-quality profile in this submarket — average credit score on applications, eviction rate, late-payment / NSF rate, and stable-employment percentage? A property-management company in the area should have these aggregated.
- How much new apartment / multifamily construction is in the pipeline within 1–3 miles? Heavy new supply (>2% of stock underway) typically softens rents 12–24 months out; light construction supports rent growth.
CashFlowRE · CFR-Y1JB4X1NMX3C7H
· Data 3 weeks ago
cashflowre.app · 2026-05-29