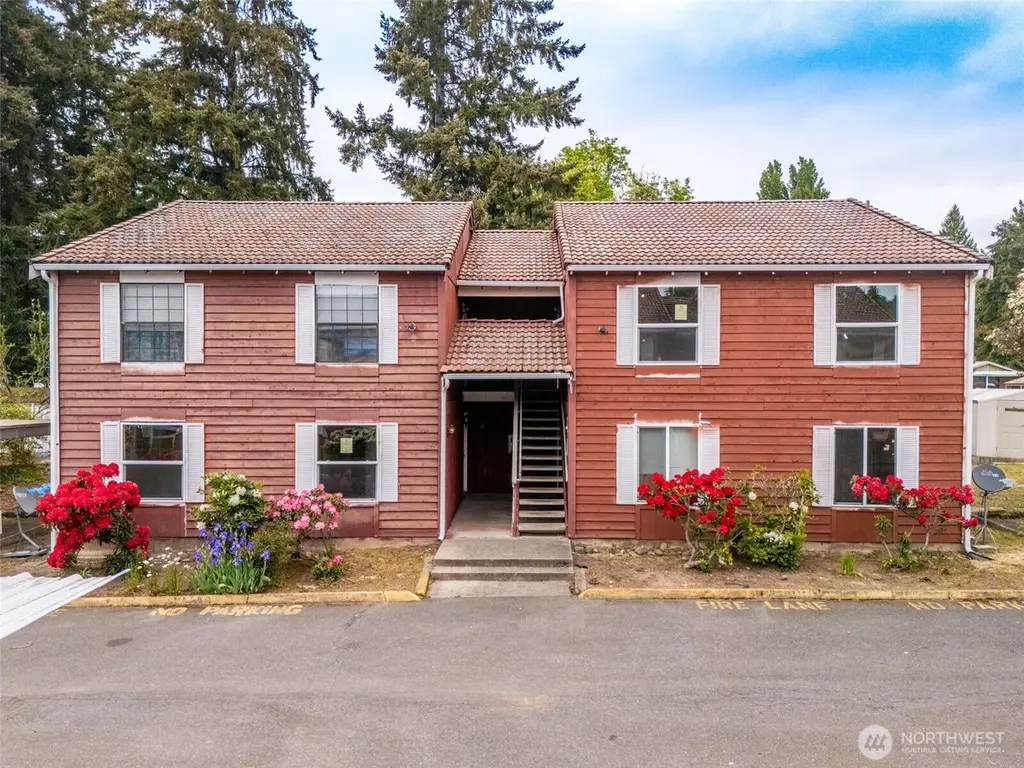
 12-Plex
3714 D St SE · Auburn, WA
Flood risk 1/10 · Minimal
- FEMA flood zone
- X (unshaded)
- Chance of flooding over 30 yrs
- 0.0%
- Est. flood insurance / yr
- $507 – $1,088
Fire risk 1/10 · Minimal
- Est. fire insurance / yr
- $604 – $1,122
Heat risk 4/10 · Minor
- Hot days now (above 87°F)
- 7 days/yr
- Hot days in 30 yrs
- 15 days/yr
Wind risk 1/10 · Minimal
- Chance of severe wind over 30 yrs
- —
Air-quality risk 7/10 · Major
- Unhealthy air days now
- 10 days/yr
- Unhealthy air days in 30 yrs
- 11 days/yr
Risk factors via First Street. Map © Google.
Why this score? — see what drove the B- grade
The composite is a weighted blend of 9 inputs, each scored 0–100. Each bar is that input's sub-score; the figure is the points it added to the 100-point composite (weight × sub-score).
- Cash flow +27.4/30.0
- DSCR +9.6/10.0
- ARV discount +7.5/15.0
- 1% rule +7.4/10.0
- Schools +4.7/10.0
- Livability +4.0/5.0
- Rent growth +2.7/5.0
- Condition / age +2.5/5.0
- Appreciation +0.0/10.0
$1,800,000
🖨 Deal sheet (PDF) 📄 Offer letter ✓ Due diligence
Multi-family units
County records classify this as Multi-Family (2-4 Unit). Listing-text estimate: 12 units. estimate disagrees with records
Listing remarks
Auburn Oaks Apartments - 12-unit value-add apartment complex. With 10 / 12 units currently vacant, the property offers an ideal opportunity for immediate renovation and repositioning without the typical challenge of tenant displacement. Built in 1985, the property features functional 2 Bed / 1.5 Bath (1,066SqFt) layouts with in-unit W/ D, covered parking, fireplaces, balconies/patios, and floor plans well suited for modernization. A buyer may find the opportunity to improve the bathroom mix and open up kitchen/living areas, buyer to verify. Current rents shown are proforma based on projected post-renovation performance.
Key facts
- Fireplaces
- Covered parking
- In-unit w d
Tags
Property features AI
Finance
- Other: Possible use: Multi-family
- Financial info: Listing terms: Cash; Gross scheduled income: $302,400; Gross adjusted income: $287,280; Total monthly income: $25,200; Net operating income: $199,396; Total expenses: $87,884; Electric expense: $5,000; Insurance expense: $7,000; Other expenses: $34,737; Gross rent multiplier: 6; Vacancy rate: 5%; Total units: 12
Exterior
- Parking: 24 covered parking spaces; 20 carport spaces; 4 uncovered parking spaces
- Security: Partially fenced (security feature)
- Utilities: Electric energy source; Community water (city); Sewer connected (city); Power provided by PSE
- Home design: Residential income property (multi-family); Multi-family structure; 2 stories; Has view; Style: 10+ units; Property condition: fixer
- Construction: Standard frame construction; Wood construction materials; Tile roof; Slab foundation; Effective year built: 1990
- Exterior features: Wood exterior and wood products; Deck; Partially fenced; Paved with sidewalk
Interior
- Kitchen: Each unit includes a range/oven; Each unit includes a refrigerator; Each unit includes a dishwasher
- Bedrooms: Twelve 2-bedroom units (each unit listed as 2 bedrooms)
- Flooring: Vinyl flooring; Carpet flooring
- Bathrooms: Twelve 2-bath units (each unit listed as 2 bathrooms)
- Heating & cooling: Baseboard heating; No central cooling
- Interior features: Vinyl and carpet flooring
- Laundry & utility: Each unit includes washer and dryer
Neighborhood map
What this means for you Summary
Snapshot
- This is a 12 × 2.0-bed/1.5-bath units multifamily listed at $1.80M.
Deal economics
- At list price, monthly cash flow is $5k ($63k/yr) — positive. Per door: $440/mo.
- The deal already cash-flows at list — no discount required.
- Meets the 1% rule at list price ($22k rent vs $1.80M).
- Cap rate 9.8% vs local median 2.7% in Auburn — top-decile yield for the area; either an underpriced asset or a hidden risk that comps aren't pricing in. Stress-test before assuming the spread holds.
Location & tenants
- Location reads 81/100 on livability (#75 in WA, #1,371 nationally) — a professional / high-income tenant draw. Strengths: amenities A+, commute A+, employment A+; Watch: crime F, cost of living F.
- Auburn School District (urban): math 47% / reading 56% proficiency, ranked #125 of 291 in WA (top 43%) — acceptable for families but not a draw, mixed tenant base, ~2y average lease.
- Zoned schools: Gildo Rey Elementary School (412 students, 76% FRL); Auburn Riverside High School (1,909 students, 50% FRL) — zoned schools average 63% FRL vs 44% district-wide (19 pts higher); higher-poverty schools than district average — tighter screening recommended.
- Market conditions: Rents flat; 326 active listings in the ZIP; solid renter incomes; 10,555 units permitted in King County in 2024 (7,119 in 5+ unit buildings).
- At $22,403/mo this rent would consume 330% of the median local household income ($81k/yr) (locally 1278% of renters already pay >50% of income on rent) — very limited rent-growth headroom before tenants either downsize or default.
Forward outlook
- Local home prices are declining (-3.0%/yr); year-one equity from $12k of loan paydown is wiped out by about $54k of value loss. Plan a longer hold.
- King County population projected at +44% by 2050 — long-run rental-demand tailwind backs the buy-and-hold thesis.
Negotiation context
- Only 14 days on market — expect competitive offers; lowballing is unlikely to land.
- 2 sale attempts since 26y ago with the ask held roughly flat each time — persistent listings suggest the price (not the market) is what's stuck; bring a comps-based counter.
- Current owner paid $767k; list at $1.80M implies a 135% gain — meaningful room to come down on a strong offer.
Questions for the listing agent
- Can we see the unit-by-unit rent roll, current vacancy, and any below-market leases? What's the average tenancy length?
- What capital expenditures (roof, boiler, parking lot, exteriors) have been made in the last 5 years, and what's planned in the next 2?
- Is there a deadline driving the sale (1031 exchange, divorce, estate, relocation)? That informs how much negotiation room exists.
- Crime grade is F in this area — have there been break-ins, vandalism, or insurance claims at this property in the last 3 years? What carrier currently insures it and at what premium?
- What's the average days-on-market for RENTAL listings here right now (not sales)? A rising rental-DOM trend means longer vacancies and softer asking-rent achievability than the comps imply.
- What's the recent tenant-quality profile in this submarket — average credit score on applications, eviction rate, late-payment / NSF rate, and stable-employment percentage? A property-management company in the area should have these aggregated.
- How much new apartment / multifamily construction is in the pipeline within 1–3 miles? Heavy new supply (>2% of stock underway) typically softens rents 12–24 months out; light construction supports rent growth.
Investment metrics
- 1% rule
- 1.24% ✓
- Cap rate
- 9.82%
- Cash-on-cash
- 12.58%
- DSCR
- 1.56
- GRM
- 6.7
CMA / ARV
No comps found within radius.
Projected returns pro-forma
-3.0% appreciation · 0.75% rent growth · sell at horizon
- IRR
- -0.2%
- Equity multiple
- 0.99×
- Total profit
- $-4,462
- Equity at exit
- $268,386
- IRR
- 6.9%
- Equity multiple
- 1.47×
- Total profit
- $236,149
- Equity at exit
- $155,631
Cash invested: $504,000 (down + closing). Projections, not guarantees.
Landlord ↔ Tenant lean methodology
- Overall (STATE)
- 28 Tenant-Leaning
- State Washington
- 28 Tenant-Leaning · D+8
- County
- — inherits STATE
- City
- — inherits STATE
ZIP-level market 98801
- Rents YoY
- 0.8%
- Active inventory
- 326
- Price-to-rent
- 80.3×
Monthly cashflow live
- Estimated rent
- $22,403 high interval (Pro) →
- Mortgage (P&I)
- −$9,439
- Tax from tax record
- −$2,226 /mo · $26,708/yr
- Insurance
- −$750
- HOA
- −$0
- Vacancy / Maint / Mgmt
- −$4,705
- Net cashflow
- $5,283
Break-even live
Sensitivity live
| Price | -10% $6,302 | -5% $5,793 | +0% $5,283 | +5% $4,774 | +10% $4,264 |
|---|---|---|---|---|---|
| Rent | -10% $3,513 | -5% $4,398 | +0% $5,283 | +5% $6,168 | +10% $7,053 |
| Rate | -1.0pp $6,190 | -0.5pp $5,741 | base $5,283 | +0.5pp $4,817 | +1.0pp $4,342 |
12-unit breakdown (identical units grouped — click to expand)
| Units | Beds | Baths | Est. rent |
|---|---|---|---|
| 12× units | 2.0 | 1.5 | $22,404 |
| #1 | 2.0 | 1.5 | $1,867 |
| #2 | 2.0 | 1.5 | $1,867 |
| #3 | 2.0 | 1.5 | $1,867 |
| #4 | 2.0 | 1.5 | $1,867 |
| #5 | 2.0 | 1.5 | $1,867 |
| #6 | 2.0 | 1.5 | $1,867 |
| #7 | 2.0 | 1.5 | $1,867 |
| #8 | 2.0 | 1.5 | $1,867 |
| #9 | 2.0 | 1.5 | $1,867 |
| #10 | 2.0 | 1.5 | $1,867 |
| #11 | 2.0 | 1.5 | $1,867 |
| #12 | 2.0 | 1.5 | $1,867 |
| Total (12 units) | $22,403 | ||
UW: 25.0% down · 7.5% · 30yr · 1.5% tax · 5.0% vac · 8.0% maint · 8.0% mgmt
Financing live
Cash to close
- Down payment
- $450,000
- Closing costs
- $54,000
- Reserves months
- —
- Total cash needed
- —
Loan-product check · same deal, 3 products live
Conventional
25% down · 7.5% · 30yr
- Down + closing
- —
- Monthly P&I
- —
- Monthly cashflow
- —
- DSCR
- —
- Eligible?
- —
Personal DTI + credit; lowest rate.
DSCR
20% down · 8.5% · 30yr
- Down + closing
- —
- Monthly P&I
- —
- Monthly cashflow
- —
- DSCR
- —
- Eligible?
- —
No personal income docs; deal must DSCR.
Hard money
10% down · 12.0% · 12mo
- Down + closing
- —
- Monthly P&I
- —
- Monthly cashflow
- —
- DSCR
- —
- Eligible?
- —
Short-term bridge; refi at stabilization.
Listing history 5 events
-
2026-05-14$1,800,000 Active
-
2004-01-29soldstatus $767,000
-
2000-06-01soldstatus $649,950
-
2000-05-31historical
-
2000-03-10$649,950
ⓘ Source: listings_history table (triggers on properties + properties_extension) + one-shot
backfill from property_details.listing_events for pre-trigger history.
Tax reassessment forecast WA · Resets to sale price
- Current annual tax
- $26,708 · $2,226/mo
- Projected year-2 tax
- $26,708 · $2,226/mo
- Expected delta
- $0/yr ($0/mo · 0.0%)
ⓘ Screening estimate from a state-policy table — verify with the county assessor before closing.
Climate risk First Street
- Flood 1/10 Low FEMA zone X (unshaded) · 0% chance over 30 yrs
- Wildfire 1/10 Low
- Heat 4/10 Moderate 7 d/yr ≥87°F today · 15 d/yr by 30 yrs out
- Wind 1/10 Low
- Air quality 7/10 Severe 10 unhealthy d/yr today · 11 by 30 yrs out
Nearby sold comps map
Loading sold comps map…
Walkable amenities ~0.75 mi
Loading nearby amenities…
Taxation est. · year 1
- Rental income
- $268,836
- − Mortgage interest
- −$100,828
- − Property taxes
- −$26,708
- − Insurance
- −$9,000
- − Repairs & maintenance
- −$21,507
- − Management
- −$21,507
- − Depreciation
- −$52,364
- Taxable income
- $36,923
- Est. tax owed @ 24.0%
- −$8,861
- After-tax cash flow
- $54,538/yr
For passive investors: Depreciation is non-cash, so a rental often shows a tax loss while cash-flowing — sheltering income. Rental losses are passive: they offset passive income freely, and up to $25,000/yr can offset ordinary (W-2) income if you actively participate and your MAGI is under $100k (phasing out to $0 by $150k); unused losses carry forward. On sale, claimed depreciation is recaptured at up to 25%, and gains may owe capital-gains tax (a 1031 exchange can defer both). Figures are a year-1 estimate at your 24.0% rate — not tax advice; consult a CPA.
Schools (NCES district)
- District
- Auburn School District
- NCES district ID
- 5300300
- Math proficiency
- 47% ▼ -3.00%
- Reading proficiency
- 56% ▼ -1.00%
- Median HH income
- $58,048
- Composite
- 46.73/100
- National rank
- #5240
- State rank
- #125 of 291 in WA
Livability — Auburn
- Score
- 81/100
- State rank
- #75
- US rank
- #1371
Category grades
Schools grade is shown separately in the Schools card above.
Census & demographics
- Census place
- Auburn, WA
- County
- Chelan County · 53,031 people
- City population
- 74,969
- Metro
- Wenatchee, WA
- Population (ZIP)
- 45,426
- Household income
- $81,488
- Rent vs Own
- Severe rent burden
- 1278.0
Population outlook (King County) Hauer SSP2
- Today (2025)
- 2,576,485 people
- By 2030
- 2,803,316 · +8.8%
- By 2040
- 3,255,921 · +26.4%
- By 2050
- 3,706,444 · +43.9%
- By 2075
- 4,746,063 · +84.2%
- By 2100
- 5,407,730 · +109.9%
Race, ethnicity, and origin ACS 2023
- Neighborhood character
- Majority White (61%)
- Race & ethnicity
- White 61% Hispanic / Latino 33% Two or more races 14% Native American 2%
- Hispanic origin (detail)
- Mexican 28%
- Common ancestry
- Portuguese 4% Italian 3% Slovak 3%
- Foreign-born
- 14% · Canada, Dominican Republic
- Languages at home
- 72% English-only · Spanish 27%
Political lean MEDSL · King
- 2024 margin
- Solid D (+51.7) · D 74.2% · R 22.5% · Other 3.4%
- 2008→2024 swing
- +9.6pp toward D · 2008: 42.1pp · 2024: 51.7pp
- All cycles
- 2024: D+51.7 2020: D+52.7 2016: D+50.4 2012: D+39.9 2008: D+42.1
Not yet ingested
- Civics
- —
Market trends
- HPI YoY
- ▼ -569.39%
- Current HPI
- 227.1555
- Rent YoY
- ▲ 0.75%
- Metro
- Wenatchee, WA
- State GDP YoY
- ▲ 4.65%
- F500 in state
- 22
Industry mix (Fortune 500 HQ in WA)
| Industry | F500 HQs | Revenue |
|---|---|---|
| Retail | 2 | $269B |
|
||
| Technology / Retail | 1 | $638B |
|
||
| Technology | 1 | $245B |
|
||
| Telecommunications | 1 | $38B |
|
||
| Food / Beverage | 1 | $36B |
|
||
| Automotive / Trucks | 1 | $34B |
|
||
Price history
+176.9% since first listed5 events — show timeline
- 2026-05-14 Listed $1,800,000 NWMLS as Distributed by MLS Grid
- 2004-01-29 Sold (Public Records) $767,000 Public Records
- 2000-06-01 Sold (MLS) $649,950 NWMLS as Distributed by MLS Grid
- 2000-05-31 Delisted — NWMLS as Distributed by MLS Grid
- 2000-03-10 Listed $649,950 NWMLS as Distributed by MLS Grid
Property tax history
+4.2%/yrLatest (2025): $26,708 · -7.1% YoY. Source: county tax records.
Cash-flow waterfall
monthlySold comps — $/sqft
last 12 mo · ≤1 miLoading sold comps…