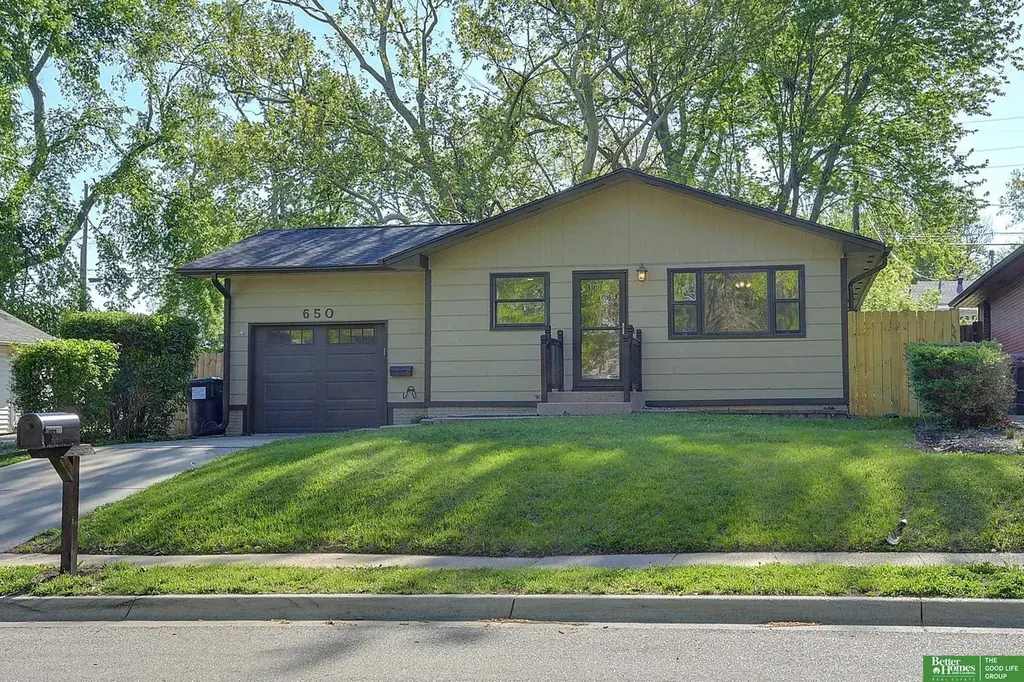
650 S 55 St
Lincoln, NE 68510
$240,000D+
3 bd · 1.5 ba ·
1,925 sqft ·
Built 1975
· SingleFamily
· Pending
· 2 DOM
Cashflow @ list (25.0% down · 7.5%)
Estimated rent
$1,927/mo
Mortgage (P&I)
−$1,259
Tax + insurance
−$342
HOA
−$0
Vac / Maint / Mgmt
−$405
Net cashflow
$-78/mo
Annual
$-936/yr
Cap rate
5.90%
Cash-on-cash
-1.39%
DSCR
0.94
1% rule
0.80%
Cash to close
$67,200
Investor read
- This is a 3-bed/1.5-bath single-family listed at $240k.
- At list price, monthly cash flow is $-78 ($-936/yr) — negative.
- To cash-flow at today's rent, offer at most $226k (5.7% below list).
- To meet the 1% rule (rent ≥ 1% of price), the offer needs to be $193k (19.7% below list).
- Only 2 days on market — expect competitive offers; lowballing is unlikely to land.
- Recommended offer: $193k (19.7% below list) — sets the bar for 1% rule.
- Local home prices are declining (-3.0%/yr); year-one equity from $2k of loan paydown is wiped out by about $7k of value loss. Plan a longer hold.
- Location reads 85/100 on livability (#5 in NE, #545 nationally) — a professional / high-income tenant draw. Strengths: amenities A+, cost of living A+, housing A+; Watch: crime D+.
- Lincoln Public Schools (urban): math 50% / reading 53% proficiency, ranked #59 of 111 in NE (top 53%) — acceptable for families but not a draw, mixed tenant base, ~2y average lease.
- Zoned schools: Eastridge Elementary School (math 52% / reading 57%, grade C, #161 of 502 statewide, top 38%, 282 students, 36% FRL); Lefler Middle School (math 46% / reading 45%, grade D+, #63 of 128 statewide, top 50%, 613 students, 61% FRL); Lincoln East High School (math 58% / reading 60%, grade C+, #69 of 261 statewide, top 26%, 2,268 students, 21% FRL) — zoned schools at 39% FRL track the district average.
- Market conditions: Rents rising (+1.8%/yr); 124 active listings in the ZIP; 5 comparable units currently listed for rent nearby; rentals at typical pace (median 23d on market — plan ~3-4 weeks tenant-placement turnaround); 40% of comp listings sitting > 30 days — soft ceiling on asking rent; 1,940 units permitted in Lancaster County in 2024 (895 in 5+ unit buildings).
- Lancaster County population projected at +37% by 2050 — long-run rental-demand tailwind backs the buy-and-hold thesis.
- Cap rate 5.9% vs local median 3.0% in Lincoln — top-decile yield for the area; either an underpriced asset or a hidden risk that comps aren't pricing in. Stress-test before assuming the spread holds.
- This rent runs 35% of the median local income ($66k/yr) — at the standard rent-burdened threshold; future hikes will face affordability resistance.
Questions for listing agent
- What do current leases actually rent for vs. the listed asking? Can we see a recent rent roll and the last 12 months of T-12 income?
- Built in 1975 — when were the roof, HVAC, electrical panel, plumbing, and water heater last replaced?
- Is there a deadline driving the sale (1031 exchange, divorce, estate, relocation)? That informs how much negotiation room exists.
- Schools are A-rated — typically a magnet for longer-tenancy family renters. What's the average tenant stay here, and is there a school-zone premium baked into asking?
- Crime grade is D in this area — have there been break-ins, vandalism, or insurance claims at this property in the last 3 years? What carrier currently insures it and at what premium?
- The area grade is low — what's the realistic commute time and amenity access for the typical tenant pool here? Any planned neighborhood developments (good or bad) we should know about?
- What's the average days-on-market for RENTAL listings here right now (not sales)? A rising rental-DOM trend means longer vacancies and softer asking-rent achievability than the comps imply.
- What's the recent tenant-quality profile in this submarket — average credit score on applications, eviction rate, late-payment / NSF rate, and stable-employment percentage? A property-management company in the area should have these aggregated.
CashFlowRE · CFR-Y3EW4YE3DJG6DK
· Data 4 weeks ago
cashflowre.app · 2026-05-29