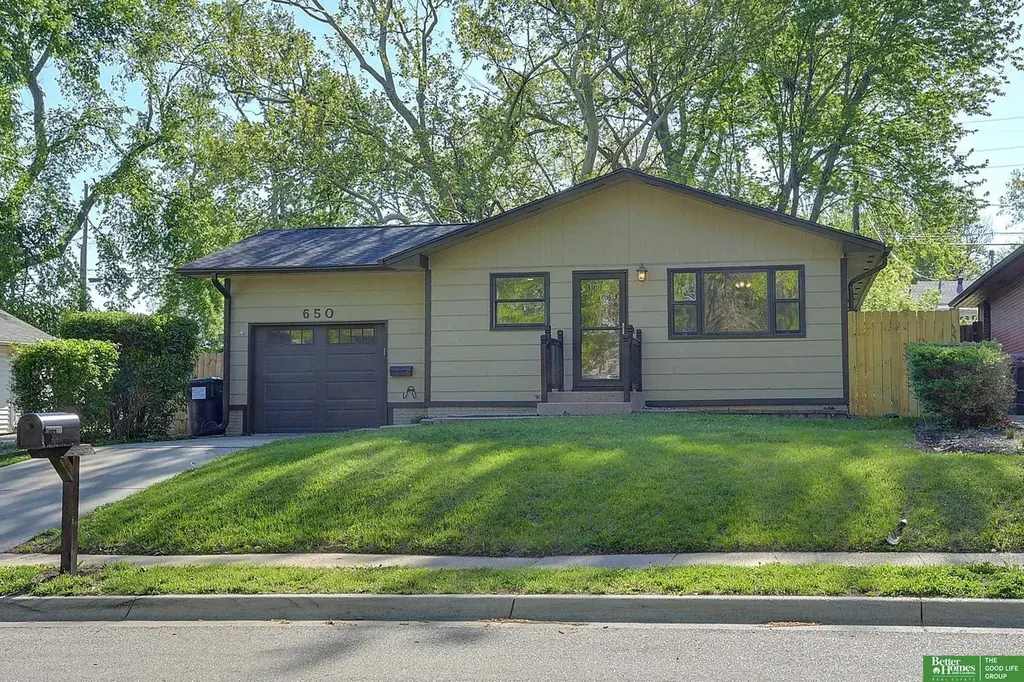
650 S 55 St · Lincoln, NE
Flood risk 1/10 · Minimal
- FEMA flood zone
- X (unshaded)
- Chance of flooding over 30 yrs
- 0.0%
- Est. flood insurance / yr
- $473 – $860
Fire risk 1/10 · Minimal
- Est. fire insurance / yr
- $1,161 – $2,155
Heat risk 3/10 · Minor
- Hot days now (above 104°F)
- 7 days/yr
- Hot days in 30 yrs
- 15 days/yr
Wind risk 2/10 · Minimal
- Chance of severe wind over 30 yrs
- —
Air-quality risk 1/10 · Minimal
- Unhealthy air days now
- 0 days/yr
- Unhealthy air days in 30 yrs
- 0 days/yr
Risk factors via First Street. Map © Google.
Why this score? — see what drove the D+ grade
The composite is a weighted blend of 9 inputs, each scored 0–100. Each bar is that input's sub-score; the figure is the points it added to the 100-point composite (weight × sub-score).
- ARV discount +13.0/15.0
- Cash flow +11.5/30.0
- Schools +4.4/10.0
- Livability +4.2/5.0
- DSCR +3.4/10.0
- 1% rule +3.0/10.0
- Rent growth +2.9/5.0
- Condition / age +2.5/5.0
- Appreciation +0.0/10.0
$240,000
🖨 Deal sheet (PDF) 📄 Offer letter ✓ Due diligence
Listing remarks
This 4 bedroom, 2 bathroom home with nearly 2,000 square feet is located in the heart of Lincoln. Numerous recent repairs and upgrades make this home move-in ready. The exterior (and many rooms) have been freshly painted. This home is larger than it looks. Head inside to a large living room, a functional kitchen, and 3 bedrooms on the main floor. Head downstairs to the fully finished basement with a large rec room, laundry room, and a 4th bedroom. There’s also an updated bathroom with a large walk-in shower. The attached one car garage has a new epoxy floor, newer insulated garage door, and a smart opener with camera. Finally, head outside and enjoy the large fenced backyard and patio
Key facts
- Large rec room
- New epoxy floor
- Updated bathroom
Tags
Property features AI
Exterior
- Parking: Attached garage with one covered space and garage door opener; One parking space total
- Utilities: Public water; Public sewer; Electricity available; Natural gas available
- Home design: Single-family residence; Residential property; Not new (built in 1975)
- Construction: Wood siding; Composition roof; Concrete perimeter foundation; Built in 1975; Approximately 1,986 total building area with about 1,025 above grade and 961 below grade finished
- Exterior features: Porch; Patio; Full wood fencing; Public sidewalk
Interior
- Kitchen: Range; Refrigerator; Dishwasher; Dining area
- Bedrooms: Main floor primary bedroom with ceiling fan; Main floor additional bedrooms with ceiling fans; Basement bedroom with egress window
- Flooring: Luxury vinyl plank; Ceramic tile
- Bathrooms: Two bathrooms total — one full and one three-quarter; one on the main level and one below grade
- Heating & cooling: Natural gas forced-air heat; Central air conditioning
- Interior features: Ceiling fans; Daylight and egress basement, partially finished; Window coverings
- Laundry & utility: Laundry area with luxury vinyl plank flooring; Humidifier
Neighborhood map
What this means for you Summary
Snapshot
- This is a 3-bed/1.5-bath single-family listed at $240k.
Deal economics
- At list price, monthly cash flow is $-78 ($-936/yr) — negative.
- To cash-flow at today's rent, offer at most $226k (5.7% below list).
- To meet the 1% rule (rent ≥ 1% of price), the offer needs to be $193k (19.7% below list).
- Recommended offer: $193k (19.7% below list) — sets the bar for 1% rule.
- Cap rate 5.9% vs local median 3.0% in Lincoln — top-decile yield for the area; either an underpriced asset or a hidden risk that comps aren't pricing in. Stress-test before assuming the spread holds.
Location & tenants
- Location reads 85/100 on livability (#5 in NE, #545 nationally) — a professional / high-income tenant draw. Strengths: amenities A+, cost of living A+, housing A+; Watch: crime D+.
- Lincoln Public Schools (urban): math 50% / reading 53% proficiency, ranked #59 of 111 in NE (top 53%) — acceptable for families but not a draw, mixed tenant base, ~2y average lease.
- Zoned schools: Eastridge Elementary School (math 52% / reading 57%, grade C, #161 of 502 statewide, top 38%, 282 students, 36% FRL); Lefler Middle School (math 46% / reading 45%, grade D+, #63 of 128 statewide, top 50%, 613 students, 61% FRL); Lincoln East High School (math 58% / reading 60%, grade C+, #69 of 261 statewide, top 26%, 2,268 students, 21% FRL) — zoned schools at 39% FRL track the district average.
- Market conditions: Rents rising (+1.8%/yr); 124 active listings in the ZIP; 5 comparable units currently listed for rent nearby; rentals at typical pace (median 23d on market — plan ~3-4 weeks tenant-placement turnaround); 40% of comp listings sitting > 30 days — soft ceiling on asking rent; 1,940 units permitted in Lancaster County in 2024 (895 in 5+ unit buildings).
- This rent runs 35% of the median local income ($66k/yr) — at the standard rent-burdened threshold; future hikes will face affordability resistance.
Forward outlook
- Local home prices are declining (-3.0%/yr); year-one equity from $2k of loan paydown is wiped out by about $7k of value loss. Plan a longer hold.
- Lancaster County population projected at +37% by 2050 — long-run rental-demand tailwind backs the buy-and-hold thesis.
Negotiation context
- Only 2 days on market — expect competitive offers; lowballing is unlikely to land.
Questions for the listing agent
- What do current leases actually rent for vs. the listed asking? Can we see a recent rent roll and the last 12 months of T-12 income?
- Built in 1975 — when were the roof, HVAC, electrical panel, plumbing, and water heater last replaced?
- Is there a deadline driving the sale (1031 exchange, divorce, estate, relocation)? That informs how much negotiation room exists.
- Schools are A-rated — typically a magnet for longer-tenancy family renters. What's the average tenant stay here, and is there a school-zone premium baked into asking?
- Crime grade is D in this area — have there been break-ins, vandalism, or insurance claims at this property in the last 3 years? What carrier currently insures it and at what premium?
- The area grade is low — what's the realistic commute time and amenity access for the typical tenant pool here? Any planned neighborhood developments (good or bad) we should know about?
- What's the average days-on-market for RENTAL listings here right now (not sales)? A rising rental-DOM trend means longer vacancies and softer asking-rent achievability than the comps imply.
- What's the recent tenant-quality profile in this submarket — average credit score on applications, eviction rate, late-payment / NSF rate, and stable-employment percentage? A property-management company in the area should have these aggregated.
- How much new for-sale + rental construction is in the pipeline within 1–3 miles? Heavy new supply typically softens prices + rents 12–24 months out; constrained supply supports both.
Investment metrics
- 1% rule
- 0.80% ✗
- Cap rate
- 5.90%
- Cash-on-cash
- -1.39%
- DSCR
- 0.94
- GRM
- 10.4
CMA / ARV
- ARV (median comp)
- $273,573
- List price
- $240,000
- Delta
- -12.27%
- Verdict
- UNDERPRICED
- Comps
- 20 within 1.0 mi
Show comp detail 12 sales within ~0.75 mi
| Address | Dist | Beds/Ba | Sqft | Sold | Price | $/sf | Match |
|---|---|---|---|---|---|---|---|
| 650 S 55 St | 0.00mi | 4/2.0 (+1) | 1,986 (+3%) | 1mo | $247,000 | $124 | 87 |
| 728 Eastridge Dr | 0.18mi | 3/2.0 | 1,864 (-3%) | 2mo | $343,000 | $184 | 83 |
| 700 S 50th St | 0.31mi | 4/2.0 (+1) | 1,875 (-3%) | 0mo | $271,000 | $145 | 74 |
| 917 Ferndale Rd | 0.33mi | 3/3.0 | 1,975 (+3%) | 1mo | $334,000 | $169 | 74 |
| 5843 Randolph St | 0.26mi | 4/2.0 (+1) | 2,043 (+6%) | 1mo | $310,000 | $152 | 70 |
| 6120 Randolph St | 0.43mi | 3/2.0 | 2,020 (+5%) | 0mo | $297,500 | $147 | 70 |
| 5110 J St | 0.26mi | 3/2.0 | 2,156 (+12%) | 1mo | $325,000 | $151 | 65 |
| 5316 M St | 0.35mi | 3/3.0 | 2,037 (+6%) | 4mo | $325,000 | $160 | 65 |
| 933 Moraine Dr | 0.28mi | 4/2.5 (+1) | 2,112 (+10%) | 2mo | $279,000 | $132 | 60 |
| 1127 Mulder Dr | 0.60mi | 3/2.0 | 2,136 (+11%) | 3mo | $358,000 | $168 | 49 |
| 815 S 44th St | 0.72mi | 2/2.0 (-1) | 1,833 (-5%) | 3mo | $224,000 | $122 | 49 |
| 930 Evergreen Dr | 0.67mi | 3/3.0 | 2,197 (+14%) | 2mo | $421,000 | $192 | 37 |
Match score weights: distance 35% · size 25% · config 20% · recency 20%. Top-matched comps best support the ARV.
Projected returns pro-forma
-3.0% appreciation · 1.78% rent growth · sell at horizon
- IRR
- -19.9%
- Equity multiple
- 0.31×
- Total profit
- $-46,204
- Equity at exit
- $35,785
- IRR
- -15.6%
- Equity multiple
- 0.17×
- Total profit
- $-56,018
- Equity at exit
- $20,751
Cash invested: $67,200 (down + closing). Projections, not guarantees.
Landlord ↔ Tenant lean methodology
- Overall (STATE)
- 83 Strongly Landlord-Friendly
- State Nebraska
- 83 Strongly Landlord-Friendly · R+13
- County
- — inherits STATE
- City
- — inherits STATE
ZIP-level market 68510
- Rents YoY
- 1.8%
- Active inventory
- 124
- Price-to-rent
- 10.4×
Monthly cashflow live
- Estimated rent
- $1,927 high interval (Pro) →
- Mortgage (P&I)
- −$1,259
- Tax from tax record
- −$242 /mo · $2,904/yr
- Insurance
- −$100
- HOA
- −$0
- Vacancy / Maint / Mgmt
- −$405
- Net cashflow
- $-78
Break-even live
Sensitivity live
| Price | -10% $58 | -5% $-10 | +0% $-78 | +5% $-146 | +10% $-214 |
|---|---|---|---|---|---|
| Rent | -10% $-230 | -5% $-154 | +0% $-78 | +5% $-2 | +10% $74 |
| Rate | -1.0pp $43 | -0.5pp $-17 | base $-78 | +0.5pp $-140 | +1.0pp $-203 |
UW: 25.0% down · 7.5% · 30yr · 1.5% tax · 5.0% vac · 8.0% maint · 8.0% mgmt
Financing live
Cash to close
- Down payment
- $60,000
- Closing costs
- $7,200
- Reserves months
- —
- Total cash needed
- —
Loan-product check · same deal, 3 products live
Conventional
25% down · 7.5% · 30yr
- Down + closing
- —
- Monthly P&I
- —
- Monthly cashflow
- —
- DSCR
- —
- Eligible?
- —
Personal DTI + credit; lowest rate.
DSCR
20% down · 8.5% · 30yr
- Down + closing
- —
- Monthly P&I
- —
- Monthly cashflow
- —
- DSCR
- —
- Eligible?
- —
No personal income docs; deal must DSCR.
Hard money
10% down · 12.0% · 12mo
- Down + closing
- —
- Monthly P&I
- —
- Monthly cashflow
- —
- DSCR
- —
- Eligible?
- —
Short-term bridge; refi at stabilization.
Rent comps 5 comps
| Address | Beds | Baths | Sqft | Rent | $/sqft | DOM | Units | Dist |
|---|---|---|---|---|---|---|---|---|
| 5505 Sumner St Lincoln, NE | 3.0 | 2.0 | 1600 | $1,950 | $1.22 | 23d | 1 | 0.82mi |
| 1042 Rockhurst Dr Lincoln, NE | 3.0 | 2.5 | 1688 | $2,495 | $1.48 | 45d | 1 | 0.87mi |
| 5101 Vine St Lincoln, NE | 1.0–2.0 | 1.0–2.0 | 886 | $1,370 | $1.55 | 15d | 18 | 0.97mi |
| 1025 N 63rd St Lincoln, NE | 1.0–3.0 | 1.0–2.0 | 1157 | $1,590 | $1.37 | 15d | 7 | 1.26mi |
| 3548 R St Unit A Lincoln, NE | 4.0 | 3.5 | 1328 | $2,550 | $1.92 | 45d | 1 | 1.46mi |
Listing history 4 events
-
2026-05-03status Pending 837-char remark
-
2026-05-01$240,000 New 837-char remark
-
2007-04-04soldstatus $104,000
-
2007-04-04soldstatus $104,000
ⓘ Source: listings_history table (triggers on properties + properties_extension) + one-shot
backfill from property_details.listing_events for pre-trigger history.
Tax reassessment forecast NE · Resets to sale price
- Current annual tax
- $2,904 · $242/mo
- Projected year-2 tax
- $4,152 · $346/mo
- Expected delta
- +$1,248/yr (+$104/mo · 43.0%)
ⓘ Screening estimate from a state-policy table — verify with the county assessor before closing.
Climate risk First Street
- Flood 1/10 Low FEMA zone X (unshaded) · 0% chance over 30 yrs
- Wildfire 1/10 Low
- Heat 3/10 Moderate 7 d/yr ≥104°F today · 15 d/yr by 30 yrs out
- Wind 2/10 Low
- Air quality 1/10 Low 0 unhealthy d/yr today · 0 by 30 yrs out
Nearby sold comps map
Loading sold comps map…
Walkable amenities ~0.75 mi
Loading nearby amenities…
Taxation est. · year 1
- Rental income
- $23,127
- − Mortgage interest
- −$13,444
- − Property taxes
- −$2,904
- − Insurance
- −$1,200
- − Repairs & maintenance
- −$1,850
- − Management
- −$1,850
- − Depreciation
- −$6,982
- Taxable loss
- −$5,102
- Est. tax savings @ 24.0%
- +$1,225
- After-tax cash flow
- $288/yr
For passive investors: Depreciation is non-cash, so a rental often shows a tax loss while cash-flowing — sheltering income. Rental losses are passive: they offset passive income freely, and up to $25,000/yr can offset ordinary (W-2) income if you actively participate and your MAGI is under $100k (phasing out to $0 by $150k); unused losses carry forward. On sale, claimed depreciation is recaptured at up to 25%, and gains may owe capital-gains tax (a 1031 exchange can defer both). Figures are a year-1 estimate at your 24.0% rate — not tax advice; consult a CPA.
Schools (NCES district)
- District
- Lincoln Public Schools
- NCES district ID
- 3172840
- Math proficiency
- 50% ▼ -6.00%
- Reading proficiency
- 53% ▼ -3.00%
- Median HH income
- $50,273
- Composite
- 44.05/100
- National rank
- #2880
- State rank
- #59 of 111 in NE
Livability — Lincoln
- Score
- 85/100
- State rank
- #5
- US rank
- #545
Category grades
Schools grade is shown separately in the Schools card above.
Census & demographics
- Census place
- Lincoln, NE
- County
- Lancaster County · 291,509 people
- City population
- 291,509
- Metro
- Lincoln, NE
- Population (ZIP)
- 19,391
- Household income
- $65,951
- Rent vs Own
- Severe rent burden
- 622.0
Population outlook (Lancaster County) Hauer SSP2
- Today (2025)
- 352,806 people
- By 2030
- 377,899 · +7.1%
- By 2040
- 428,582 · +21.5%
- By 2050
- 483,103 · +36.9%
- By 2075
- 632,390 · +79.2%
- By 2100
- 759,513 · +115.3%
Race, ethnicity, and origin ACS 2023
- Neighborhood character
- Predominantly White (82%)
- Race & ethnicity
- White 82% Hispanic / Latino 7% Two or more races 6% Black 4% Asian 2%
- Hispanic origin (detail)
- Mexican 4%
- Common ancestry
- Arab 2% Romanian 2% Iranian 2%
- Foreign-born
- 6% · Canada, Vietnam
- Languages at home
- 92% English-only · Spanish 4% Other Indo-European 1% French/Haitian/Cajun 1%
Political lean MEDSL · Lancaster
- 2024 margin
- Toss-up / Even · D 51.4% · R 47.1% · Other 1.5%
- 2008→2024 swing
- -0.7pp no change · 2008: 5.0pp · 2024: 4.3pp
- All cycles
- 2024: D+4.3 2020: D+7.8 2016: D+0.1 2012: R+1.0 2008: D+5.0
Not yet ingested
- Civics
- —
Market trends
- HPI YoY
- ▼ -152.27%
- Current HPI
- 243.7469
- Rent YoY
- ▲ 1.78%
- Metro
- Lincoln, NE
- State GDP YoY
- ▲ 0.68%
- F500 in state
- 2
Industry mix (Fortune 500 HQ in NE)
| Industry | F500 HQs | Revenue |
|---|---|---|
| Conglomerate | 1 | $371B |
|
||
Price history
+144.9% since first listed5 events — show timeline
- 2026-05-29 Sold (Public Records) $254,684 Public Records
- 2026-05-29 Sold (MLS) $247,000 GPRMLS
- 2026-05-03 Pending — GPRMLS
- 2026-05-01 Listed $240,000 GPRMLS
- 2007-04-04 Sold (Public Records) $104,000 Public Records
Property tax history
+2.3%/yrLatest (2025): $2,904 · +5.5% YoY. Source: county tax records.
Cash-flow waterfall
monthlySold comps — $/sqft
last 12 mo · ≤1 miLoading sold comps…