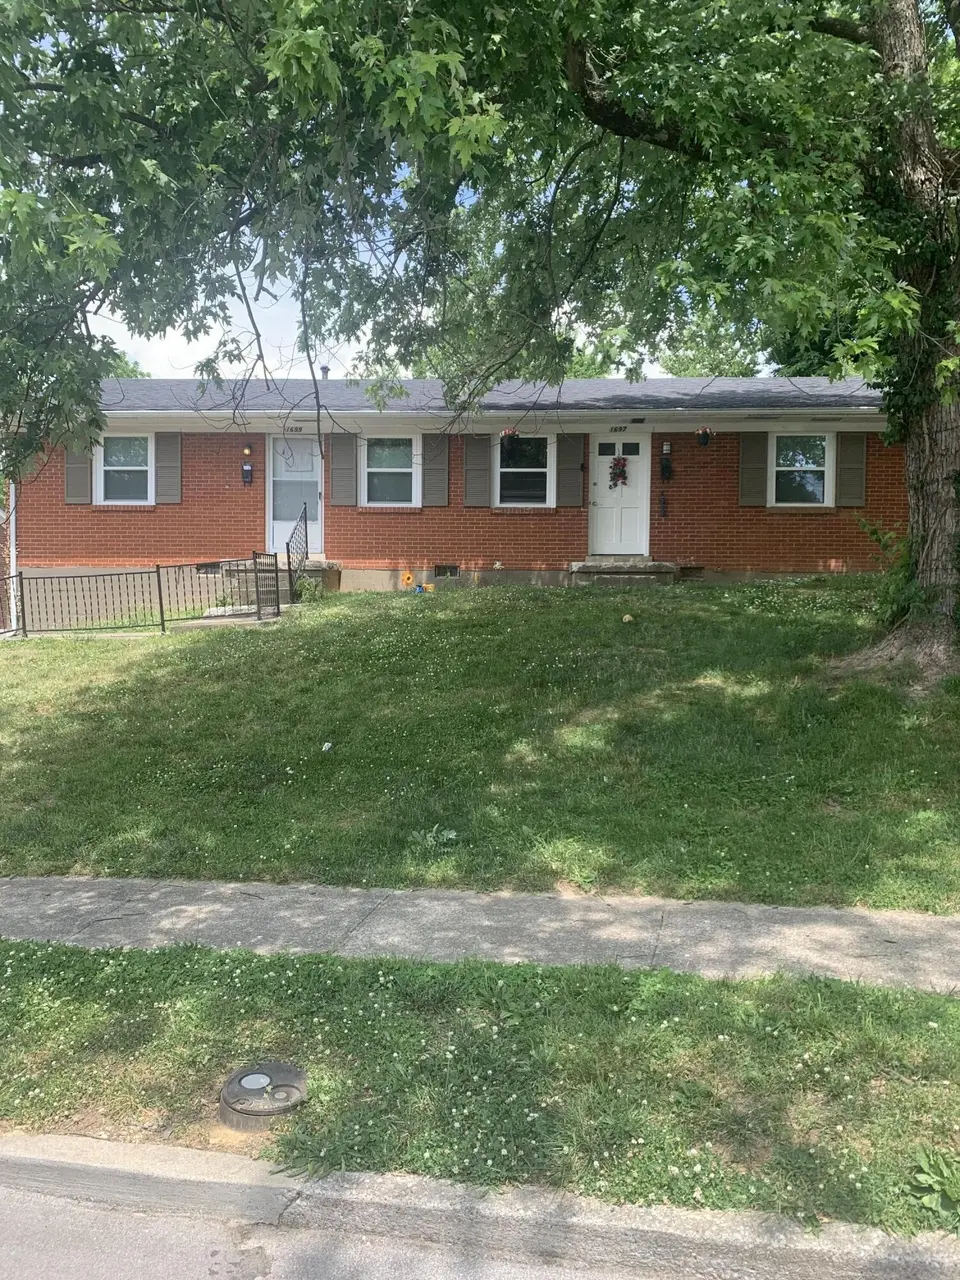
1697-1699 Hill View Place, Lexington, Ky. 40504 Pl
Lexington-Fayette, KY 40504
$240,000C+
4 bd · 2.0 ba ·
1,692 sqft ·
Built 1970
· MultiFamily
· Active
· 17 DOM
Cashflow @ list (25.0% down · 7.5%)
Estimated rent
$3,492/mo
Mortgage (P&I)
−$1,259
Tax + insurance
−$400
HOA
−$0
Vac / Maint / Mgmt
−$733
Net cashflow
$1,100/mo
Annual
$13,201/yr
Cap rate
11.79%
Cash-on-cash
19.64%
DSCR
1.87
1% rule
1.46%
Cash to close
$67,200
Investor read
- This is a 4-bed/2.0-bath multifamily listed at $240k.
- At list price, monthly cash flow is $1k ($13k/yr) — positive.
- The deal already cash-flows at list — no discount required.
- Meets the 1% rule at list price ($3k rent vs $240k).
- It's been on market 17 days — a 2% lower offer ($236k) is reasonable based on typical stale-listing flexibility.
- Recommended offer: $236k (1.5% below list) — sets the bar for market timing.
- Local home prices are declining (-3.0%/yr); year-one equity from $2k of loan paydown is wiped out by about $7k of value loss. Plan a longer hold.
- Location reads: area grade C — affects rentability + tenant quality, not the cash-flow math above.
- Fayette County (urban): math 35% / reading 45% proficiency, ranked #27 of 165 in KY (top 16%) — families likely to look elsewhere, expect single-tenant / working-renter base with shorter leases.
- Zoned schools: James Lane Allen Elementary School (math 8% / reading 22%, grade F, #620 of 676 statewide, top 93%, 420 students, 67% FRL); Leestown Middle School (math 28% / reading 44%, grade F, #91 of 217 statewide, top 43%, 966 students, 52% FRL); Paul Laurence Dunbar High School (math 51% / reading 49%, grade D+, #12 of 254 statewide, top 4%, 1,946 students, 46% FRL).
- Market conditions: Rents rising fast (+5.7%/yr); 63 active listings in the ZIP; 15 comparable units currently listed for rent nearby; rentals at typical pace (median 25d on market — plan ~3-4 weeks tenant-placement turnaround); 1,036 units permitted in Fayette County in 2024 (542 in 5+ unit buildings).
- Fayette County population projected at +35% by 2050 — long-run rental-demand tailwind backs the buy-and-hold thesis.
- 4 sale attempts since 5y ago with the ask held roughly flat each time — persistent listings suggest the price (not the market) is what's stuck; bring a comps-based counter.
- At projected returns (-3.0% appreciation + 5.7% rent growth), your $67k cash investment doubles in ~6 years — after that, you're playing with house money.
- Cap rate 11.8% vs local median 3.8% in Lexington-Fayette — top-decile yield for the area; either an underpriced asset or a hidden risk that comps aren't pricing in. Stress-test before assuming the spread holds.
- At $3,492/mo this rent would consume 91% of the median local household income ($46k/yr) (locally 2225% of renters already pay >50% of income on rent) — very limited rent-growth headroom before tenants either downsize or default.
Questions for listing agent
- Built in 1970 — when were the roof, HVAC, electrical panel, plumbing, and water heater last replaced?
- Is there a deadline driving the sale (1031 exchange, divorce, estate, relocation)? That informs how much negotiation room exists.
- What's the average days-on-market for RENTAL listings here right now (not sales)? A rising rental-DOM trend means longer vacancies and softer asking-rent achievability than the comps imply.
- What's the recent tenant-quality profile in this submarket — average credit score on applications, eviction rate, late-payment / NSF rate, and stable-employment percentage? A property-management company in the area should have these aggregated.
- How much new apartment / multifamily construction is in the pipeline within 1–3 miles? Heavy new supply (>2% of stock underway) typically softens rents 12–24 months out; light construction supports rent growth.
CashFlowRE · CFR-Y4ARNSBRWK1T3C
· Data 2 weeks ago
cashflowre.app · 2026-05-29