 Multi-family
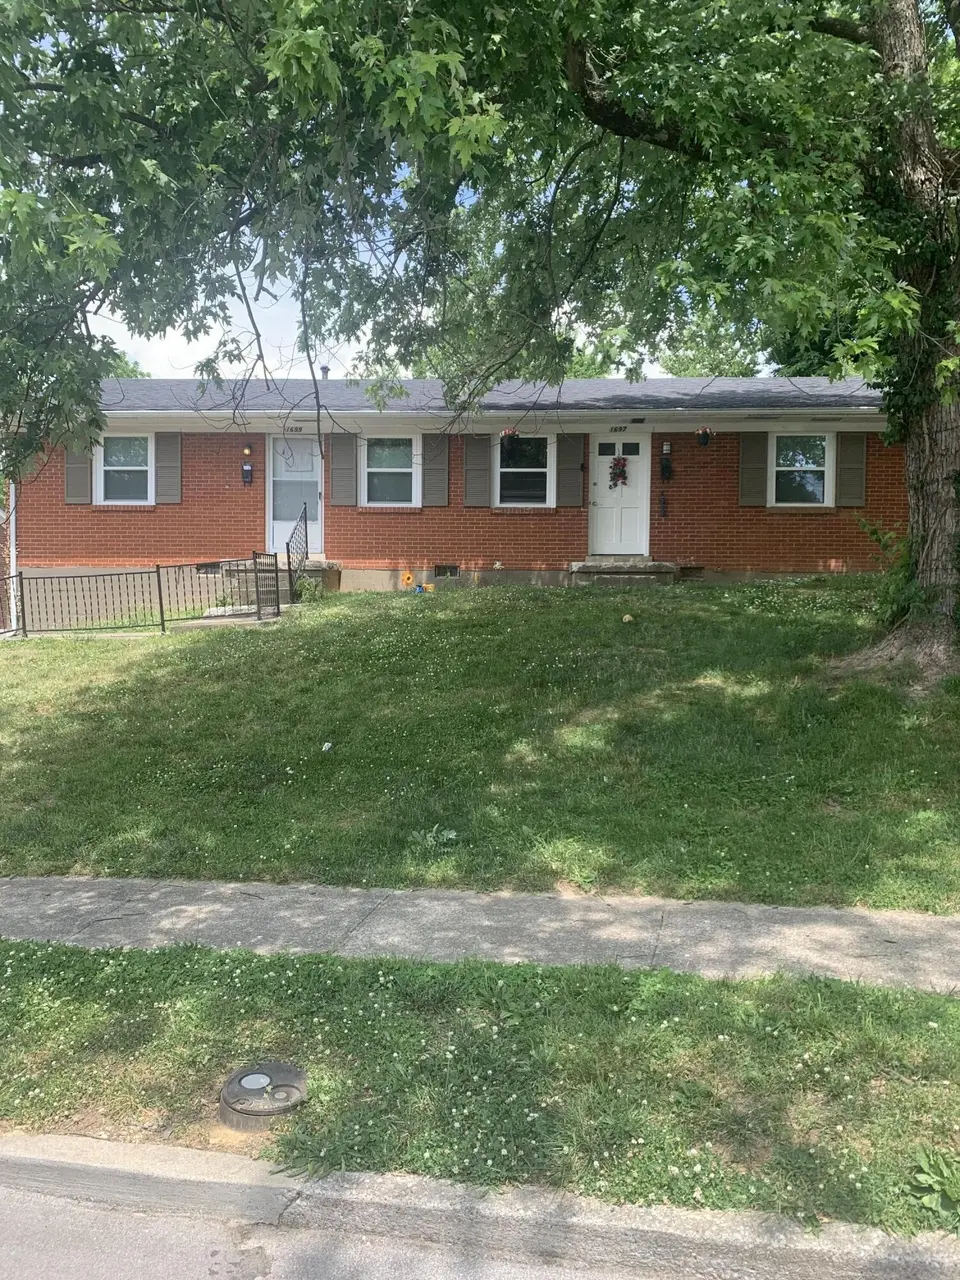
1697-1699 Hill View Place, Lexington, Ky. 40504 Pl · Lexington-Fayette, KY
Flood risk 1/10 · Minimal
- FEMA flood zone
- X (unshaded)
- Chance of flooding over 30 yrs
- 0.0%
- Est. flood insurance / yr
- $507 – $1,088
Fire risk 1/10 · Minimal
- Est. fire insurance / yr
- $839 – $1,559
Heat risk 4/10 · Minor
- Hot days now (above 101°F)
- 7 days/yr
- Hot days in 30 yrs
- 19 days/yr
Wind risk 2/10 · Minimal
- Chance of severe wind over 30 yrs
- 1.0%
Air-quality risk 1/10 · Minimal
- Unhealthy air days now
- 0 days/yr
- Unhealthy air days in 30 yrs
- 0 days/yr
Risk factors via First Street. Map © Google.
Why this score? — see what drove the C+ grade
The composite is a weighted blend of 9 inputs, each scored 0–100. Each bar is that input's sub-score; the figure is the points it added to the 100-point composite (weight × sub-score).
- Cash flow +30.0/30.0
- DSCR +10.0/10.0
- 1% rule +9.6/10.0
- Rent growth +3.9/5.0
- Schools +3.4/10.0
- Livability +2.5/5.0
- Condition / age +2.5/5.0
- ARV discount +1.8/15.0
- Appreciation +0.0/10.0
$240,000
🖨 Deal sheet (PDF) 📄 Offer letter ✓ Due diligence
Multi-family units
County records classify this as Multi-Family (2-4 Unit). Listing-text estimate: 1 unit. estimate disagrees with records
Listing remarks
Excellent rental income property. Rentals are occupied and leases in place.
Key facts
- 8,363 sq ft lot
- Built 1970
- Listed 17 days
Property features AI
Finance
- Other: Parcel number 14852175
- Financial info: Owner pays common area maintenance
Exterior
- Parking: Driveway; Off-street parking
- Utilities: Public water; Public sewer
- Home design: Duplex; Single-story
- Construction: Brick veneer exterior; Block foundation; Shingle roof; Built as a duplex (building area total 1,692)
- Exterior features: Few trees on the lot; Partial chain link fencing
Interior
- Kitchen: Refrigerator; Range
- Bedrooms: Total rooms: 2
- Flooring: Hardwood; Insulated windows with blinds and screens
- Bathrooms: 2 full bathrooms
- Heating & cooling: Natural gas heating; Electric cooling
- Interior features: Eat-in kitchen; Primary bedroom on the first floor; Accessible approach with ramp
- Laundry & utility: Laundry on the main level
Neighborhood map
What this means for you Summary
Snapshot
- This is a 4-bed/2.0-bath multifamily listed at $240k.
Deal economics
- At list price, monthly cash flow is $1k ($13k/yr) — positive.
- The deal already cash-flows at list — no discount required.
- Meets the 1% rule at list price ($3k rent vs $240k).
- Recommended offer: $236k (1.5% below list) — sets the bar for market timing.
- Cap rate 11.8% vs local median 3.8% in Lexington-Fayette — top-decile yield for the area; either an underpriced asset or a hidden risk that comps aren't pricing in. Stress-test before assuming the spread holds.
Location & tenants
- Location reads: area grade C — affects rentability + tenant quality, not the cash-flow math above.
- Fayette County (urban): math 35% / reading 45% proficiency, ranked #27 of 165 in KY (top 16%) — families likely to look elsewhere, expect single-tenant / working-renter base with shorter leases.
- Zoned schools: James Lane Allen Elementary School (math 8% / reading 22%, grade F, #620 of 676 statewide, top 93%, 420 students, 67% FRL); Leestown Middle School (math 28% / reading 44%, grade F, #91 of 217 statewide, top 43%, 966 students, 52% FRL); Paul Laurence Dunbar High School (math 51% / reading 49%, grade D+, #12 of 254 statewide, top 4%, 1,946 students, 46% FRL).
- Market conditions: Rents rising fast (+5.7%/yr); 59 active listings in the ZIP; 15 comparable units currently listed for rent nearby; rentals at typical pace (median 25d on market — plan ~3-4 weeks tenant-placement turnaround); 1,036 units permitted in Fayette County in 2024 (542 in 5+ unit buildings).
- At $3,492/mo this rent would consume 91% of the median local household income ($46k/yr) (locally 2225% of renters already pay >50% of income on rent) — very limited rent-growth headroom before tenants either downsize or default.
Forward outlook
- Local home prices are declining (-3.0%/yr); year-one equity from $2k of loan paydown is wiped out by about $7k of value loss. Plan a longer hold.
- Fayette County population projected at +35% by 2050 — long-run rental-demand tailwind backs the buy-and-hold thesis.
- At projected returns (-3.0% appreciation + 5.7% rent growth), your $67k cash investment doubles in ~6 years — after that, you're playing with house money.
Negotiation context
- It's been on market 17 days — a 2% lower offer ($236k) is reasonable based on typical stale-listing flexibility.
- 4 sale attempts since 5y ago with the ask held roughly flat each time — persistent listings suggest the price (not the market) is what's stuck; bring a comps-based counter.
Questions for the listing agent
- Built in 1970 — when were the roof, HVAC, electrical panel, plumbing, and water heater last replaced?
- Is there a deadline driving the sale (1031 exchange, divorce, estate, relocation)? That informs how much negotiation room exists.
- What's the average days-on-market for RENTAL listings here right now (not sales)? A rising rental-DOM trend means longer vacancies and softer asking-rent achievability than the comps imply.
- What's the recent tenant-quality profile in this submarket — average credit score on applications, eviction rate, late-payment / NSF rate, and stable-employment percentage? A property-management company in the area should have these aggregated.
- How much new apartment / multifamily construction is in the pipeline within 1–3 miles? Heavy new supply (>2% of stock underway) typically softens rents 12–24 months out; light construction supports rent growth.
Investment metrics
- 1% rule
- 1.46% ✓
- Cap rate
- 11.79%
- Cash-on-cash
- 19.64%
- DSCR
- 1.87
- GRM
- 5.7
CMA / ARV
- ARV (on-the-fly)
- $213,192
- Comps found
- 2
Show comp detail 2 sales within ~0.75 mi
| Address | Dist | Beds/Ba | Sqft | Sold | Price | $/sf | Match |
|---|---|---|---|---|---|---|---|
| 1908 1910 Cambridge Dr | 0.59mi | 4/2.0 | 1,700 (+0%) | 8mo | $215,000 | $126 | 64 |
| — | 0.63mi | 4/2.0 | 1,876 (+11%) | 22mo | $214,900 | $115 | 34 |
Match score weights: distance 35% · size 25% · config 20% · recency 20%. Top-matched comps best support the ARV.
Projected returns pro-forma
-3.0% appreciation · 5.7% rent growth · sell at horizon
- IRR
- 14.7%
- Equity multiple
- 1.61×
- Total profit
- $40,970
- Equity at exit
- $35,785
- IRR
- 25.4%
- Equity multiple
- 3.51×
- Total profit
- $168,366
- Equity at exit
- $20,751
Cash invested: $67,200 (down + closing). Projections, not guarantees.
Landlord ↔ Tenant lean methodology
- Overall (STATE)
- 83 Strongly Landlord-Friendly
- State Kentucky
- 83 Strongly Landlord-Friendly · R+16
- County
- — inherits STATE
- City
- — inherits STATE
ZIP-level market 40504
- Rents YoY
- 5.7%
- Active inventory
- 59
- Price-to-rent
- 11.5×
Monthly cashflow live
- Estimated rent
- $3,492 high interval (Pro) →
- Mortgage (P&I)
- −$1,259
- Tax est. 1.5%
- −$300 /mo · $3,600/yr
- Insurance
- −$100
- HOA
- −$0
- Vacancy / Maint / Mgmt
- −$733
- Net cashflow
- $1,100
Break-even live
Sensitivity live
| Price | -10% $1,266 | -5% $1,183 | +0% $1,100 | +5% $1,017 | +10% $934 |
|---|---|---|---|---|---|
| Rent | -10% $824 | -5% $962 | +0% $1,100 | +5% $1,238 | +10% $1,376 |
| Rate | -1.0pp $1,221 | -0.5pp $1,161 | base $1,100 | +0.5pp $1,038 | +1.0pp $975 |
2-unit breakdown (identical units grouped — click to expand)
| Units | Beds | Baths | Est. rent |
|---|---|---|---|
| 2× units | 4 | 2 | $3,492 |
| #1 | 4 | 2 | $1,746 |
| #2 | 4 | 2 | $1,746 |
| Total (2 units) | $3,492 | ||
UW: 25.0% down · 7.5% · 30yr · 1.5% tax · 5.0% vac · 8.0% maint · 8.0% mgmt
Financing live
Cash to close
- Down payment
- $60,000
- Closing costs
- $7,200
- Reserves months
- —
- Total cash needed
- —
Loan-product check · same deal, 3 products live
Conventional
25% down · 7.5% · 30yr
- Down + closing
- —
- Monthly P&I
- —
- Monthly cashflow
- —
- DSCR
- —
- Eligible?
- —
Personal DTI + credit; lowest rate.
DSCR
20% down · 8.5% · 30yr
- Down + closing
- —
- Monthly P&I
- —
- Monthly cashflow
- —
- DSCR
- —
- Eligible?
- —
No personal income docs; deal must DSCR.
Hard money
10% down · 12.0% · 12mo
- Down + closing
- —
- Monthly P&I
- —
- Monthly cashflow
- —
- DSCR
- —
- Eligible?
- —
Short-term bridge; refi at stabilization.
Rent comps 15 comps
| Address | Beds | Baths | Sqft | Rent | $/sqft | DOM | Units | Dist |
|---|---|---|---|---|---|---|---|---|
| 208 Linwood Dr Lexington, KY | 3.0 | 1.0 | 1200 | $1,600 | $1.33 | 24d | 1 | 0.29mi |
| 1603 Glover Ave Lexington, KY | 3.0 | 1.0 | 1336 | $1,650 | $1.24 | 24d | 1 | 0.37mi |
| 1100 Horsemans Ln Lexington, KY | 3.0 | 2.0 | 1250 | $1,500 | $1.20 | 24d | 1 | 0.49mi |
| 845 Red Mile Rd Lexington, KY | 1.0–3.0 | 1.0–2.0 | 821 | $1,953 | $2.38 | 15d | 33 | 0.50mi |
| 1100 Horsemans Ln Unit HM37 Lexington, KY | 3.0 | 2.5 | 1500 | $1,500 | $1.00 | 24d | 1 | 0.51mi |
| 1885 Dunkirk Dr Lexington, KY | 3.0 | 1.0 | 1090 | $1,600 | $1.47 | 15d | 1 | 0.65mi |
| 1728 Shenandoah Dr Lexington, KY | 3.0 | 1.0 | 1125 | $1,650 | $1.47 | 15d | 1 | 0.74mi |
| 1220 Hammond Ave Lexington, KY | 4.0 | 2.0 | 1949 | $1,850 | $0.95 | 15d | 1 | 0.82mi |
| 1079 Duncan Ave Lexington, KY | 3.0 | 1.0 | 1175 | $1,950 | $1.66 | 24d | 1 | 0.93mi |
| 217 Creekside Ct Lexington, KY | 3.0 | 1.5 | 1275 | $1,350 | $1.06 | 24d | 1 | 1.13mi |
| 1720 Traveller Rd Lexington, KY | 3.0 | 2.0 | 1287 | $1,950 | $1.52 | 24d | 1 | 1.18mi |
| 1929 Alexandria Dr Lexington, KY | 3.0 | 2.0 | 1304 | $2,145 | $1.64 | 24d | 1 | 1.24mi |
| 120 Clyde St Lexington, KY | 3.0 | 1.0 | 1242 | $1,450 | $1.17 | 24d | 1 | 1.29mi |
| 324 S Broadway Park Lexington, KY | 5.0 | 2.0 | 1588 | $4,500 | $2.83 | 24d | 1 | 1.29mi |
| 149 Old Towne Walk Lexington, KY | 1.0–3.0 | 1.0–3.0 | 906 | $1,964 | $2.17 | 24d | 1 | 1.48mi |
Listing history 14 events
-
2026-06-05days on market $240,000 Active 17 DOM
-
2026-06-03days on market $240,000 Active 16 DOM
-
2026-06-02days on market $240,000 Active 15 DOM
-
2026-06-01days on market $240,000 Active 14 DOM
-
2026-05-31days on market $240,000 Active 13 DOM
-
2026-05-31days on market $240,000 Active 12 DOM
-
2026-05-18$240,000 Active
-
2021-09-16historical
-
2021-09-06status Active
-
2021-08-29historical Contingent
-
2021-08-25status Active
-
2021-08-19historical
-
2021-08-19price $169,000
-
2021-08-14$171,600 Active
ⓘ Source: listings_history table (triggers on properties + properties_extension) + one-shot
backfill from property_details.listing_events for pre-trigger history.
Climate risk First Street
- Flood 1/10 Low FEMA zone X (unshaded) · 0% chance over 30 yrs
- Wildfire 1/10 Low
- Heat 4/10 Moderate 7 d/yr ≥101°F today · 19 d/yr by 30 yrs out
- Wind 2/10 Low 100% chance of damaging wind over 30 yrs
- Air quality 1/10 Low 0 unhealthy d/yr today · 0 by 30 yrs out
Nearby sold comps map
Loading sold comps map…
Walkable amenities ~0.75 mi
Loading nearby amenities…
Taxation est. · year 1
- Rental income
- $41,904
- − Mortgage interest
- −$13,444
- − Property taxes
- −$3,600
- − Insurance
- −$1,200
- − Repairs & maintenance
- −$3,352
- − Management
- −$3,352
- − Depreciation
- −$6,982
- Taxable income
- $9,974
- Est. tax owed @ 24.0%
- −$2,394
- After-tax cash flow
- $10,807/yr
For passive investors: Depreciation is non-cash, so a rental often shows a tax loss while cash-flowing — sheltering income. Rental losses are passive: they offset passive income freely, and up to $25,000/yr can offset ordinary (W-2) income if you actively participate and your MAGI is under $100k (phasing out to $0 by $150k); unused losses carry forward. On sale, claimed depreciation is recaptured at up to 25%, and gains may owe capital-gains tax (a 1031 exchange can defer both). Figures are a year-1 estimate at your 24.0% rate — not tax advice; consult a CPA.
Schools (NCES district)
- District
- Fayette County
- NCES district ID
- 2101860
- Math proficiency
- 35% ▼ -16.00%
- Reading proficiency
- 45% ▼ -13.00%
- Median HH income
- $49,245
- Composite
- 34.38/100
- National rank
- #5211
- State rank
- #27 of 165 in KY
Livability — Lexington-Fayette
No livability data for this city. (Only ~50 U.S. cities are tracked.)
Census & demographics
- Census place
- Lexington-Fayette, KY
- County
- Fayette County · 317,143 people
- City population
- 321,882
- Metro
- Lexington-Fayette, KY
- Population (ZIP)
- 25,816
- Household income
- $46,055
- Rent vs Own
- Severe rent burden
- 2225.0
Population outlook (Fayette County) Hauer SSP2
- Today (2025)
- 363,454 people
- By 2030
- 388,270 · +6.8%
- By 2040
- 438,688 · +20.7%
- By 2050
- 490,667 · +35.0%
- By 2075
- 625,394 · +72.1%
- By 2100
- 721,354 · +98.5%
Race, ethnicity, and origin ACS 2023
- Neighborhood character
- Diverse neighborhood (Simpson 0.57)
- Race & ethnicity
- White 61% Hispanic / Latino 18% Black 15% Two or more races 9% Asian 2%
- Hispanic origin (detail)
- Mexican 13%
- Common ancestry
- Slovak 2% Iranian 2% Lithuanian 2%
- Foreign-born
- 15% · Canada, China
- Languages at home
- 79% English-only · Spanish 15% Arabic 1% Chinese 1%
Political lean MEDSL · Fayette
- 2024 margin
- D (+18.1) · D 58.0% · R 39.9% · Other 2.1%
- 2008→2024 swing
- +13.3pp toward D · 2008: 4.8pp · 2024: 18.1pp
- All cycles
- 2024: D+18.1 2020: D+20.8 2016: D+9.5 2012: D+1.0 2008: D+4.8
Not yet ingested
- Civics
- —
Market trends
- HPI YoY
- ▼ -221.10%
- Current HPI
- 255.3941
- Rent YoY
- ▲ 5.70%
- Metro
- Lexington-Fayette, KY
- State GDP YoY
- ▲ 1.81%
- F500 in state
- 4
Industry mix (Fortune 500 HQ in KY)
| Industry | F500 HQs | Revenue |
|---|---|---|
| Healthcare | 1 | $118B |
|
||
| Food / Beverage | 1 | $7B |
|
||
Price history
+39.9% since first listed8 events — show timeline
- 2026-05-18 Listed $240,000 ImagineMLS
- 2021-09-16 Listing Removed — ImagineMLS
- 2021-09-06 Relisted — ImagineMLS
- 2021-08-29 Contingent — ImagineMLS
- 2021-08-25 Relisted — ImagineMLS
- 2021-08-19 Listing Removed — ImagineMLS
- 2021-08-19 Price Changed $169,000 ImagineMLS
- 2021-08-14 Listed $171,600 ImagineMLS
Cash-flow waterfall
monthlySold comps — $/sqft
last 12 mo · ≤1 miLoading sold comps…