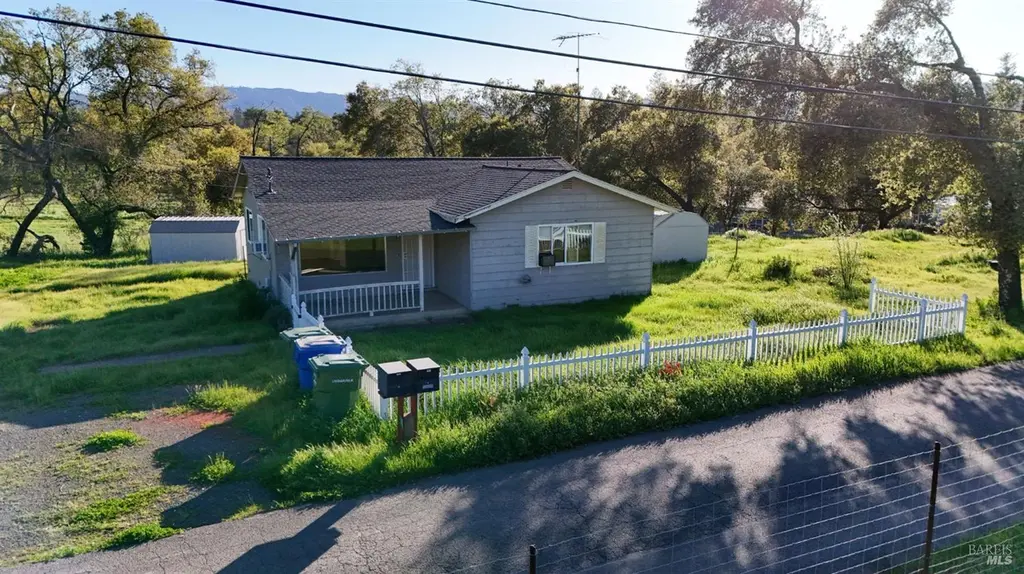
699 Mund Rd
Deer Park, CA 94574
$625,000D+
3 bd · 1.5 ba ·
1,410 sqft ·
Built 1941
· Land
· Pending
· 52 DOM
Cashflow @ list (25.0% down · 7.5%)
Estimated rent
$5,971/mo
Mortgage (P&I)
−$3,278
Tax + insurance
−$1,042
HOA
−$0
Vac / Maint / Mgmt
−$1,254
Net cashflow
$398/mo
Annual
$4,774/yr
Cap rate
7.06%
Cash-on-cash
2.73%
DSCR
1.12
1% rule
0.96%
Cash to close
$175,000
Investor read
- This is a 3-bed/1.5-bath land listed at $625k.
- At list price, monthly cash flow is $398 ($5k/yr) — positive.
- The deal already cash-flows at list — no discount required.
- To meet the 1% rule (rent ≥ 1% of price), the offer needs to be $597k (4.5% below list).
- It's been on market 52 days — a 3% lower offer ($606k) is reasonable based on typical stale-listing flexibility.
- Recommended offer: $597k (4.5% below list) — sets the bar for 1% rule.
- Local home prices are declining (-3.0%/yr); year-one equity from $4k of loan paydown is wiped out by about $19k of value loss. Plan a longer hold.
- Location reads 51/100 on livability (#1,058 in CA) — a working-class tenant base; expect higher turnover. Strengths: health & safety A+, crime A-, employment A-; Watch: amenities F, commute F, cost of living F.
- Saint Helena Unified (town): math 50% / reading 67% proficiency, ranked #231 of 1,400 in CA (top 16%) — acceptable for families but not a draw, mixed tenant base, ~2y average lease.
- Watch-outs: built in 1941 — expect roof / HVAC / electrical / plumbing capex.
- Market conditions: 127 active listings in the ZIP; 1 comparable units currently listed for rent nearby; high-income renter base; 427 units permitted in Napa County in 2024 (189 in 5+ unit buildings).
- Napa County population projected at +14% by 2050 — modest demand growth; plan on rents tracking national, not racing it.
- 2 sale attempts with the ask held roughly flat each time — persistent listings suggest the price (not the market) is what's stuck; bring a comps-based counter.
- Climate carrying-cost: major wildfire risk; extreme-heat days projected 7→16/yr by 2055 (HVAC capex compounding) — expect insurance premiums to compound above CPI over the hold.
- Cap rate 7.1% vs local median 1.0% in Deer Park — top-decile yield for the area; either an underpriced asset or a hidden risk that comps aren't pricing in. Stress-test before assuming the spread holds.
- At $5,971/mo this rent would consume 51% of the median local household income ($139k/yr) (locally 383% of renters already pay >50% of income on rent) — very limited rent-growth headroom before tenants either downsize or default.
Questions for listing agent
- It's been on market 52 days. Have you received any prior offers? Is the seller open to a 4% concession, seller financing, or rate buy-down credit?
- Built in 1941 — when were the roof, HVAC, electrical panel, plumbing, and water heater last replaced?
- Is there a deadline driving the sale (1031 exchange, divorce, estate, relocation)? That informs how much negotiation room exists.
- The area grade is low — what's the realistic commute time and amenity access for the typical tenant pool here? Any planned neighborhood developments (good or bad) we should know about?
- What's the average days-on-market for RENTAL listings here right now (not sales)? A rising rental-DOM trend means longer vacancies and softer asking-rent achievability than the comps imply.
- What's the recent tenant-quality profile in this submarket — average credit score on applications, eviction rate, late-payment / NSF rate, and stable-employment percentage? A property-management company in the area should have these aggregated.
- How much new for-sale + rental construction is in the pipeline within 1–3 miles? Heavy new supply typically softens prices + rents 12–24 months out; constrained supply supports both.
CashFlowRE · CFR-Y4K9AV16Y823YN
· Data 6 days ago
cashflowre.app · 2026-05-29