699 Mund Rd · Deer Park, CA
Flood risk 1/10 · Minimal
- FEMA flood zone
- X (unshaded)
- Chance of flooding over 30 yrs
- 0.0%
- Est. flood insurance / yr
- $507 – $1,088
Fire risk 7/10 · Major
- Est. fire insurance / yr
- $659 – $1,223
Heat risk 5/10 · Moderate
- Hot days now (above 98°F)
- 7 days/yr
- Hot days in 30 yrs
- 16 days/yr
Wind risk 1/10 · Minimal
- Chance of severe wind over 30 yrs
- —
Air-quality risk 10/10 · Severe
- Unhealthy air days now
- 22 days/yr
- Unhealthy air days in 30 yrs
- 22 days/yr
Risk factors via First Street. Map © Google.
Why this score? — see what drove the D+ grade
The composite is a weighted blend of 9 inputs, each scored 0–100. Each bar is that input's sub-score; the figure is the points it added to the 100-point composite (weight × sub-score).
- Cash flow +16.8/30.0
- ARV discount +7.5/15.0
- Schools +5.4/10.0
- DSCR +5.2/10.0
- 1% rule +4.6/10.0
- Livability +2.6/5.0
- Rent growth +2.5/5.0
- Condition / age +2.5/5.0
- Appreciation +0.0/10.0
$625,000
🖨 Deal sheet 📄 Offer letter ✓ Due diligence
Listing remarks
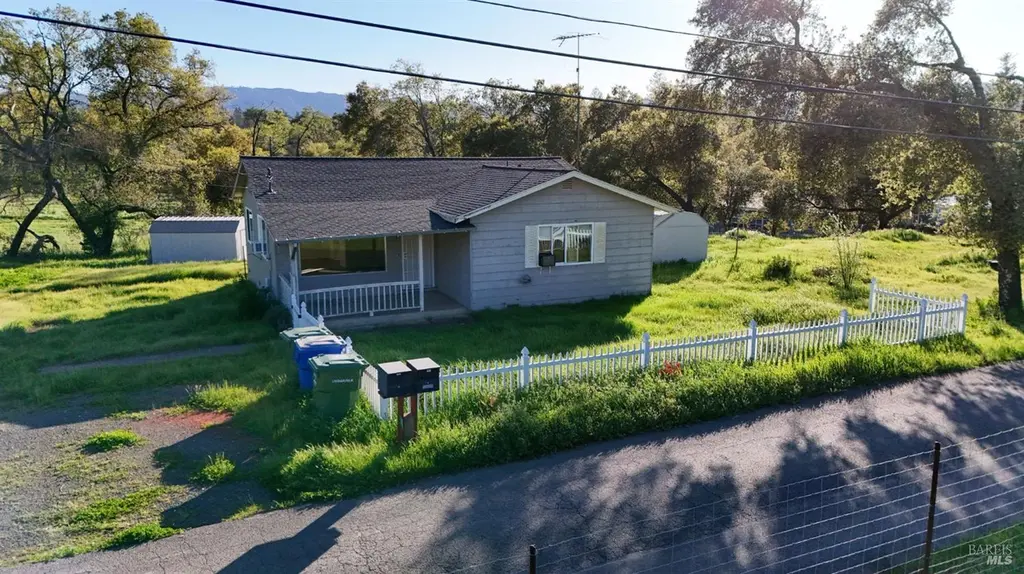
Situated on +/- 1.72 acres in a peaceful, rural setting just minutes from St. Helena, this 2-bedroom, 1 bath residence spans +/- 1,150 square feet and offers a rare opportunity to create a Napa Valley compound. The existing single-level home features a functional layout with abundant natural light, spacious living areas, and a covered front porch overlooking open grounds and surrounding vineyard landscape. Positioned within Napa County's Agricultural Watershed zoning, the property presents a compelling value-add opportunity. The existing residence may serve as a future ADU, allowing for the development of a larger primary homecreating a flexible path for end-users or investors to maximize t
Key facts
- Covered front porch
- Napa valley compound
- 1.72 acres
Tags
Property features AI
Finance
- HOA & community: No homeowners association; Not a senior community
Exterior
- Parking: No garage
- Utilities: Cable available; Internet available; Septic system
- Home design: Single-family residence; One story
- Exterior features: Does not allow horses; Irregular-shaped lot; See remarks for additional lot details
Interior
- Kitchen: Gas cooking
- Bedrooms: 2 bedrooms
- Flooring: Carpet; Laminate
- Bathrooms: 1 full bathroom
- Heating & cooling: Central heating; Ceiling fans; Window air conditioning units
- Interior features: Built-in gas oven; Built-in gas range; Free-standing refrigerator
- Laundry & utility: Indoor laundry hookups
Neighborhood map
What this means for you Summary
Snapshot
- This is a 3-bed/1.5-bath land listed at $625k.
Deal economics
- At list price, monthly cash flow is $398 ($5k/yr) — positive.
- The deal already cash-flows at list — no discount required.
- To meet the 1% rule (rent ≥ 1% of price), the offer needs to be $597k (4.5% below list).
- Recommended offer: $597k (4.5% below list) — sets the bar for 1% rule.
- Cap rate 7.1% vs local median 1.0% in Deer Park — top-decile yield for the area; either an underpriced asset or a hidden risk that comps aren't pricing in. Stress-test before assuming the spread holds.
Location & tenants
- Location reads 51/100 on livability (#1,058 in CA) — a working-class tenant base; expect higher turnover. Strengths: health & safety A+, crime A-, employment A-; Watch: amenities F, commute F, cost of living F.
- Saint Helena Unified (town): math 50% / reading 67% proficiency, ranked #231 of 1,400 in CA (top 16%) — acceptable for families but not a draw, mixed tenant base, ~2y average lease.
- Market conditions: 127 active listings in the ZIP; 1 comparable units currently listed for rent nearby; high-income renter base; 427 units permitted in Napa County in 2024 (189 in 5+ unit buildings).
- At $5,971/mo this rent would consume 51% of the median local household income ($139k/yr) (locally 383% of renters already pay >50% of income on rent) — very limited rent-growth headroom before tenants either downsize or default.
Forward outlook
- Local home prices are declining (-3.0%/yr); year-one equity from $4k of loan paydown is wiped out by about $19k of value loss. Plan a longer hold.
- Napa County population projected at +14% by 2050 — modest demand growth; plan on rents tracking national, not racing it.
Negotiation context
- It's been on market 52 days — a 3% lower offer ($606k) is reasonable based on typical stale-listing flexibility.
- 2 sale attempts with the ask held roughly flat each time — persistent listings suggest the price (not the market) is what's stuck; bring a comps-based counter.
Risks & watch-outs
- Watch-outs: built in 1941 — expect roof / HVAC / electrical / plumbing capex.
- Climate carrying-cost: major wildfire risk; extreme-heat days projected 7→16/yr by 2055 (HVAC capex compounding) — expect insurance premiums to compound above CPI over the hold.
Questions for the listing agent
- It's been on market 52 days. Have you received any prior offers? Is the seller open to a 4% concession, seller financing, or rate buy-down credit?
- Built in 1941 — when were the roof, HVAC, electrical panel, plumbing, and water heater last replaced?
- Is there a deadline driving the sale (1031 exchange, divorce, estate, relocation)? That informs how much negotiation room exists.
- The area grade is low — what's the realistic commute time and amenity access for the typical tenant pool here? Any planned neighborhood developments (good or bad) we should know about?
- What's the average days-on-market for RENTAL listings here right now (not sales)? A rising rental-DOM trend means longer vacancies and softer asking-rent achievability than the comps imply.
- What's the recent tenant-quality profile in this submarket — average credit score on applications, eviction rate, late-payment / NSF rate, and stable-employment percentage? A property-management company in the area should have these aggregated.
- How much new for-sale + rental construction is in the pipeline within 1–3 miles? Heavy new supply typically softens prices + rents 12–24 months out; constrained supply supports both.
Investment metrics
- 1% rule
- 0.96% ✗
- Cap rate
- 7.06%
- Cash-on-cash
- 2.73%
- DSCR
- 1.12
- GRM
- 8.7
CMA / ARV
No comps found within radius.
Projected returns pro-forma
-3.0% appreciation · 3.0% rent growth · sell at horizon
- IRR
- -12.0%
- Equity multiple
- 0.57×
- Total profit
- $-75,851
- Equity at exit
- $93,190
- IRR
- -2.8%
- Equity multiple
- 0.81×
- Total profit
- $-33,060
- Equity at exit
- $54,039
Cash invested: $175,000 (down + closing). Projections, not guarantees.
Landlord ↔ Tenant lean methodology
- Overall (STATE)
- 18 Strongly Tenant-Friendly
- State California
- 18 Strongly Tenant-Friendly · D+13
- County
- — inherits STATE
- City
- — inherits STATE
ZIP-level market 94574
- Active inventory
- 127
- Price-to-rent
- 8.7×
Monthly cashflow live
- Estimated rent
- $5,971 medium interval (Pro) →
- Mortgage (P&I)
- −$3,278
- Tax est. 1.5%
- −$781 /mo · $9,375/yr
- Insurance
- −$260
- HOA
- −$0
- Vacancy / Maint / Mgmt
- −$1,254
- Net cashflow
- $398
Break-even live
UW: 25.0% down · 7.5% · 30yr · 1.5% tax · 5.0% vac · 8.0% maint · 8.0% mgmt
Financing live
Cash to close
- Down payment
- $156,250
- Closing costs
- $18,750
- Reserves months
- —
- Total cash needed
- —
Loan-product check · same deal, 3 products live
Conventional
25% down · 7.5% · 30yr
- Down + closing
- —
- Monthly P&I
- —
- Monthly cashflow
- —
- DSCR
- —
- Eligible?
- —
Personal DTI + credit; lowest rate.
DSCR
20% down · 8.5% · 30yr
- Down + closing
- —
- Monthly P&I
- —
- Monthly cashflow
- —
- DSCR
- —
- Eligible?
- —
No personal income docs; deal must DSCR.
Hard money
10% down · 12.0% · 12mo
- Down + closing
- —
- Monthly P&I
- —
- Monthly cashflow
- —
- DSCR
- —
- Eligible?
- —
Short-term bridge; refi at stabilization.
Rent comps 1 comps
| Address | Beds | Baths | Sqft | Rent | $/sqft | DOM | Units | Dist |
|---|---|---|---|---|---|---|---|---|
| 926 Champion Ln Deer Park, CA | 2.0 | 2.0 | 1800 | $4,200 | $2.33 | 13d | 1 | 0.87mi |
Listing history 5 events
-
2026-05-16status Pending
-
2026-05-07historical Contingent (No Show)
-
2026-04-14status Active
-
2026-04-12historical Contingent (Show)
-
2026-03-25$625,000 Active
ⓘ Source: listings_history table (triggers on properties + properties_extension) + one-shot
backfill from property_details.listing_events for pre-trigger history.
Climate risk First Street
- Flood 1/10 Low FEMA zone X (unshaded) · 0% chance over 30 yrs
- Wildfire 7/10 Severe
- Heat 5/10 Major 7 d/yr ≥98°F today · 16 d/yr by 30 yrs out
- Wind 1/10 Low
- Air quality 10/10 Extreme 22 unhealthy d/yr today · 22 by 30 yrs out
Nearby sold comps map
Loading sold comps map…
Walkable amenities ~0.75 mi
Loading nearby amenities…
Taxation est. · year 1
- Rental income
- $71,651
- − Mortgage interest
- −$35,010
- − Property taxes
- −$9,375
- − Insurance
- −$3,125
- − Repairs & maintenance
- −$5,732
- − Management
- −$5,732
- − Depreciation
- −$18,182
- Taxable loss
- −$5,505
- Est. tax savings @ 24.0%
- +$1,321
- After-tax cash flow
- $6,095/yr
For passive investors: Depreciation is non-cash, so a rental often shows a tax loss while cash-flowing — sheltering income. Rental losses are passive: they offset passive income freely, and up to $25,000/yr can offset ordinary (W-2) income if you actively participate and your MAGI is under $100k (phasing out to $0 by $150k); unused losses carry forward. On sale, claimed depreciation is recaptured at up to 25%, and gains may owe capital-gains tax (a 1031 exchange can defer both). Figures are a year-1 estimate at your 24.0% rate — not tax advice; consult a CPA.
Schools (NCES district)
- District
- Saint Helena Unified
- NCES district ID
- 0637830
- Math proficiency
- 50% ▲ 5.00%
- Reading proficiency
- 67% ▲ 4.00%
- Median HH income
- $80,540
- Composite
- 54.39/100
- National rank
- #2913
- State rank
- #231 of 1400 in CA
Livability — Deer Park
- Score
- 51/100
- State rank
- #1058
- US rank
- #25217
Category grades
Schools grade is shown separately in the Schools card above.
Census & demographics
- Census place
- Deer Park, CA
- County
- Napa County · 120,669 people
- City population
- 130
- Metro
- Napa, CA
- Population (ZIP)
- 7,457
- Household income
- $139,474
- Rent vs Own
- Severe rent burden
- 383.0
Population outlook (Napa County) Hauer SSP2
- Today (2025)
- 153,987 people
- By 2030
- 159,490 · +3.6%
- By 2040
- 168,796 · +9.6%
- By 2050
- 176,213 · +14.4%
- By 2075
- 190,113 · +23.5%
- By 2100
- 190,528 · +23.7%
Race, ethnicity, and origin ACS 2023
- Neighborhood character
- Predominantly White (68%)
- Race & ethnicity
- White 68% Hispanic / Latino 27% Two or more races 10% Asian 1%
- Hispanic origin (detail)
- Mexican 22%
- Common ancestry
- Italian 6% Lithuanian 4% German 3%
- Foreign-born
- 22% · Canada, Dominican Republic
- Languages at home
- 73% English-only · Spanish 22% Other Indo-European 1% French/Haitian/Cajun 1%
Political lean MEDSL · Napa
- 2024 margin
- Solid D (+34.9) · D 65.9% · R 31.1% · Other 3.0%
- 2008→2024 swing
- +2.4pp toward D · 2008: 32.5pp · 2024: 34.9pp
- All cycles
- 2024: D+34.9 2020: D+40.4 2016: D+35.2 2012: D+25.7 2008: D+32.5
Not yet ingested
- Civics
- —
Market trends
- HPI YoY
- ▼ -711.97%
- Current HPI
- 203.5761
- Rent YoY
- —
- Metro
- Napa, CA
- State GDP YoY
- ▲ 3.21%
- F500 in state
- 116
Industry mix (Fortune 500 HQ in CA)
| Industry | F500 HQs | Revenue |
|---|---|---|
| Technology | 27 | $1,492B |
|
||
| Financial Services | 3 | $174B |
|
||
| Retail | 3 | $44B |
|
||
| Insurance | 3 | $26B |
|
||
| Media / Entertainment | 2 | $115B |
|
||
| Pharmaceuticals / Biotech | 2 | $62B |
|
||
Price history
5 events — show timeline
- 2026-05-16 Pending — BAREIS
- 2026-05-07 Contingent — BAREIS
- 2026-04-14 Relisted — BAREIS
- 2026-04-12 Contingent — BAREIS
- 2026-03-25 Listed $625,000 BAREIS
Property tax history
-3.5%/yrLatest (2025): $829 · +1.7% YoY. Source: county tax records.
Cash-flow waterfall
monthlySold comps — $/sqft
last 12 mo · ≤1 miLoading sold comps…