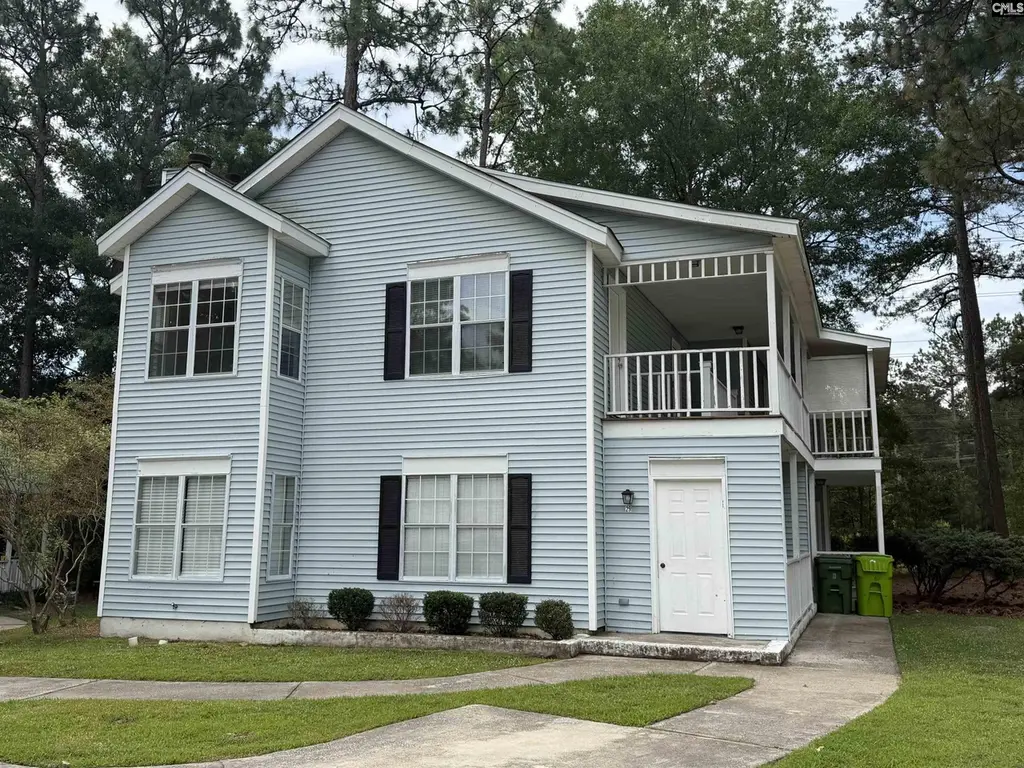
29 Battery Walk Ct
St. Andrews, SC 29212
$150,000D
3 bd · 2.0 ba ·
1,247 sqft ·
Built 1985
· Townhouse
· Active
· 13 DOM
Cashflow @ list (25.0% down · 7.5%)
Estimated rent
$1,586/mo
Mortgage (P&I)
−$787
Tax + insurance
−$250
HOA
−$232
Vac / Maint / Mgmt
−$333
Net cashflow
$-16/mo
Annual
$-189/yr
Cap rate
6.17%
Cash-on-cash
-0.45%
DSCR
0.98
1% rule
1.06%
Cash to close
$42,000
Investor read
- This is a 3-bed/2.0-bath townhouse listed at $150k. Condition is rated good.
- At list price, monthly cash flow is $-16 ($-189/yr) — negative.
- To cash-flow at today's rent, offer at most $148k (1.5% below list).
- Meets the 1% rule at list price ($2k rent vs $150k).
- Only 13 days on market — expect competitive offers; lowballing is unlikely to land.
- Recommended offer: $148k (1.5% below list) — sets the bar for cash-flow.
- Local home prices are declining (-3.0%/yr); year-one equity from $1k of loan paydown is wiped out by about $4k of value loss. Plan a longer hold.
- Location reads: area grade D — affects rentability + tenant quality, not the cash-flow math above.
- Richland 01 (urban): math 26% / reading 36% proficiency, ranked #54 of 80 in SC (top 68%) — families likely to look elsewhere, expect single-tenant / working-renter base with shorter leases; 64% free/reduced lunch — lower-income household profile, screen leases tightly.
- Zoned schools: Pine Grove Elementary (math 24% / reading 15%, grade F, #496 of 597 statewide, top 83%, 541 students, 100% FRL); Columbia High (math 17% / reading 67%, grade F, #174 of 196 statewide, top 90%, 665 students, 100% FRL) — zoned schools average 100% FRL vs 64% district-wide (36 pts higher); higher-poverty schools than district average — tighter screening recommended.
- Market conditions: Rents soft (-0.2%/yr); 211 active listings in the ZIP; 17 comparable units currently listed for rent nearby; rentals at typical pace (median 23d on market — plan ~3-4 weeks tenant-placement turnaround); solid renter incomes; 3,472 units permitted in Richland County in 2024 (1,096 in 5+ unit buildings).
- Richland County population projected at +30% by 2050 — long-run rental-demand tailwind backs the buy-and-hold thesis.
- Climate carrying-cost: major wind risk, 59% chance of damaging wind over 30y; extreme-heat days projected 7→16/yr by 2055 (HVAC capex compounding) — expect insurance premiums to compound above CPI over the hold.
Questions for listing agent
- What do current leases actually rent for vs. the listed asking? Can we see a recent rent roll and the last 12 months of T-12 income?
- What does the HOA fee cover, when was the last increase, and are there any pending special assessments or reserve-fund shortfalls?
- Is there a deadline driving the sale (1031 exchange, divorce, estate, relocation)? That informs how much negotiation room exists.
- The area grade is low — what's the realistic commute time and amenity access for the typical tenant pool here? Any planned neighborhood developments (good or bad) we should know about?
- What's the average days-on-market for RENTAL listings here right now (not sales)? A rising rental-DOM trend means longer vacancies and softer asking-rent achievability than the comps imply.
- What's the recent tenant-quality profile in this submarket — average credit score on applications, eviction rate, late-payment / NSF rate, and stable-employment percentage? A property-management company in the area should have these aggregated.
- How much new for-sale + rental construction is in the pipeline within 1–3 miles? Heavy new supply typically softens prices + rents 12–24 months out; constrained supply supports both.
CashFlowRE · CFR-Y5H6PYB20C303D
· Data 5 h ago
cashflowre.app · 2026-05-29