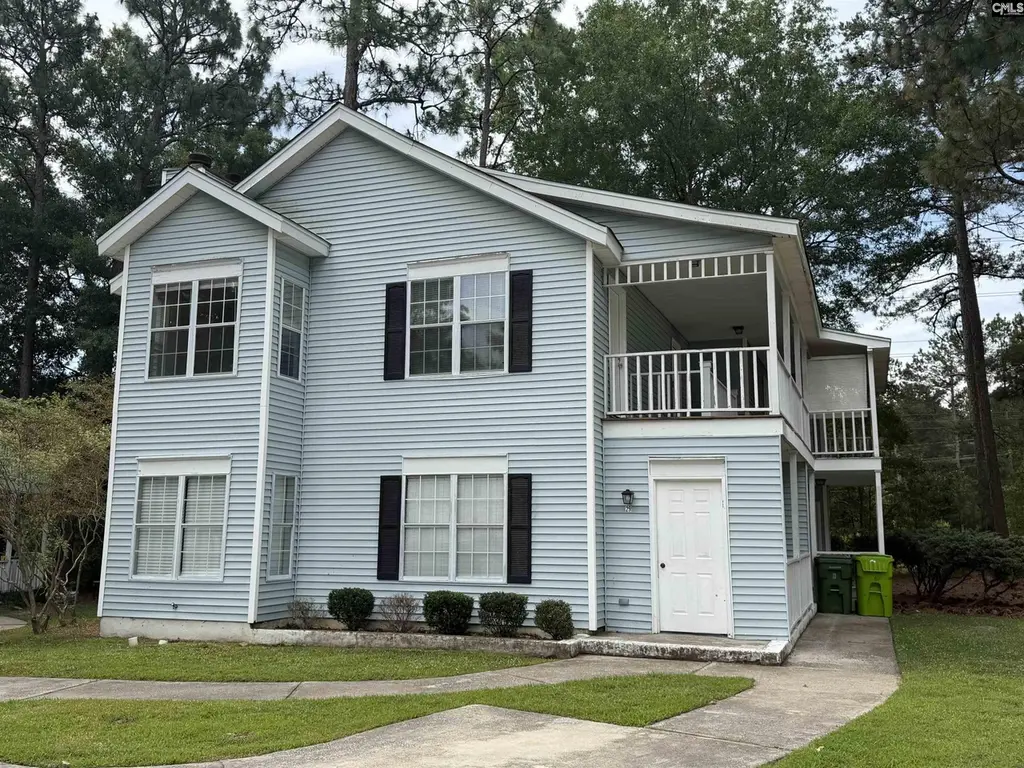
29 Battery Walk Ct · St. Andrews, SC
Flood risk 1/10 · Minimal
- FEMA flood zone
- X (unshaded)
- Chance of flooding over 30 yrs
- 0.0%
- Est. flood insurance / yr
- $507 – $1,088
Fire risk 3/10 · Minor
- Est. fire insurance / yr
- $783 – $1,453
Heat risk 6/10 · Moderate
- Hot days now (above 108°F)
- 7 days/yr
- Hot days in 30 yrs
- 16 days/yr
Wind risk 6/10 · Moderate
- Chance of severe wind over 30 yrs
- 59.0%
Air-quality risk 3/10 · Minor
- Unhealthy air days now
- 2 days/yr
- Unhealthy air days in 30 yrs
- 3 days/yr
Risk factors via First Street. Map © Google.
Why this score? — see what drove the D grade
The composite is a weighted blend of 9 inputs, each scored 0–100. Each bar is that input's sub-score; the figure is the points it added to the 100-point composite (weight × sub-score).
- Cash flow +12.7/30.0
- ARV discount +7.5/15.0
- 1% rule +5.6/10.0
- DSCR +3.8/10.0
- Condition / age +3.8/5.0
- Schools +2.6/10.0
- Livability +2.5/5.0
- Rent growth +2.4/5.0
- Appreciation +0.0/10.0
$150,000
🖨 Deal sheet (PDF) 📄 Offer letter ✓ Due diligence
Listing remarks
Welcome home to this charming, low-maintenance second-floor condo tucked away in a quiet, family-friendly community. Inside, you’ll fall in love with the airy, open-concept floor plan. The spacious living area features a cozy fireplace with custom built-ins, flowing seamlessly into a modern kitchen with updated appliances—perfect for hosting friends or enjoying a quiet night in. Escape to the primary suite, complete with a private bath and a large walk-in closet. Best of all, French doors lead you directly onto your private covered porch. Because you're on the second floor, it’s the ultimate elevated retreat to unwind, look out over the mature trees, and enjoy your morning
Key facts
- Updated appliances
- Second floor condo
- Private bath
Tags
Property features AI
Finance
- Other: Directions: From Harbison Blvd. left onto Tawny Branch Rd. 1.2 miles, right onto Battery Walk
- HOA & community: Homeowners association present
Exterior
- Parking: One parking space
- Utilities: Public sewer
- Home design: Single-family property
- Construction: Slab foundation
- Exterior features: Vinyl exterior; Paved road access; Approximately 0.01 acre lot; Public water
Interior
- Bedrooms: Primary bedroom on the main level
- Bathrooms: Two full bathrooms
- Interior features: One fireplace; Central heating and central air
Neighborhood map
What this means for you Summary
Snapshot
- This is a 3-bed/2.0-bath townhouse listed at $150k. Condition is rated good.
Deal economics
- At list price, monthly cash flow is $-16 ($-189/yr) — negative.
- To cash-flow at today's rent, offer at most $148k (1.5% below list).
- Meets the 1% rule at list price ($2k rent vs $150k).
- Recommended offer: $148k (1.5% below list) — sets the bar for cash-flow.
Location & tenants
- Location reads: area grade D — affects rentability + tenant quality, not the cash-flow math above.
- Richland 01 (urban): math 26% / reading 36% proficiency, ranked #54 of 80 in SC (top 68%) — families likely to look elsewhere, expect single-tenant / working-renter base with shorter leases; 64% free/reduced lunch — lower-income household profile, screen leases tightly.
- Zoned schools: Pine Grove Elementary (math 24% / reading 15%, grade F, #496 of 597 statewide, top 83%, 541 students, 100% FRL); Columbia High (math 17% / reading 67%, grade F, #174 of 196 statewide, top 90%, 665 students, 100% FRL) — zoned schools average 100% FRL vs 64% district-wide (36 pts higher); higher-poverty schools than district average — tighter screening recommended.
- Market conditions: Rents soft (-0.2%/yr); 206 active listings in the ZIP; 17 comparable units currently listed for rent nearby; rentals at typical pace (median 22d on market — plan ~3-4 weeks tenant-placement turnaround); solid renter incomes; 3,472 units permitted in Richland County in 2024 (1,096 in 5+ unit buildings).
Forward outlook
- Local home prices are declining (-3.0%/yr); year-one equity from $1k of loan paydown is wiped out by about $4k of value loss. Plan a longer hold.
- Richland County population projected at +30% by 2050 — long-run rental-demand tailwind backs the buy-and-hold thesis.
Negotiation context
- Only 10 days on market — expect competitive offers; lowballing is unlikely to land.
Risks & watch-outs
- Climate carrying-cost: major wind risk, 59% chance of damaging wind over 30y; extreme-heat days projected 7→16/yr by 2055 (HVAC capex compounding) — expect insurance premiums to compound above CPI over the hold.
Questions for the listing agent
- What do current leases actually rent for vs. the listed asking? Can we see a recent rent roll and the last 12 months of T-12 income?
- What does the HOA fee cover, when was the last increase, and are there any pending special assessments or reserve-fund shortfalls?
- Is there a deadline driving the sale (1031 exchange, divorce, estate, relocation)? That informs how much negotiation room exists.
- The area grade is low — what's the realistic commute time and amenity access for the typical tenant pool here? Any planned neighborhood developments (good or bad) we should know about?
- What's the average days-on-market for RENTAL listings here right now (not sales)? A rising rental-DOM trend means longer vacancies and softer asking-rent achievability than the comps imply.
- What's the recent tenant-quality profile in this submarket — average credit score on applications, eviction rate, late-payment / NSF rate, and stable-employment percentage? A property-management company in the area should have these aggregated.
- How much new for-sale + rental construction is in the pipeline within 1–3 miles? Heavy new supply typically softens prices + rents 12–24 months out; constrained supply supports both.
Investment metrics
- 1% rule
- 1.06% ✓
- Cap rate
- 6.17%
- Cash-on-cash
- -0.45%
- DSCR
- 0.98
- GRM
- 7.9
CMA / ARV
No comps found within radius.
Projected returns pro-forma
-3.0% appreciation · 0.0% rent growth · sell at horizon
- IRR
- -21.1%
- Equity multiple
- 0.29×
- Total profit
- $-29,789
- Equity at exit
- $22,365
- IRR
- -26.7%
- Equity multiple
- -0.06×
- Total profit
- $-44,514
- Equity at exit
- $12,969
Cash invested: $42,000 (down + closing). Projections, not guarantees.
Landlord ↔ Tenant lean methodology
- Overall (STATE)
- 90 Strongly Landlord-Friendly
- State South Carolina
- 90 Strongly Landlord-Friendly · R+6
- County
- — inherits STATE
- City
- — inherits STATE
ZIP-level market 29212
- Rents YoY
- -0.2%
- Active inventory
- 206
- Price-to-rent
- 7.9×
Monthly cashflow live
- Estimated rent
- $1,586 high interval (Pro) →
- Mortgage (P&I)
- −$787
- Tax est. 1.5%
- −$188 /mo · $2,250/yr
- Insurance
- −$62
- HOA
- −$232
- Vacancy / Maint / Mgmt
- −$333
- Net cashflow
- $-16
Break-even live
Sensitivity live
| Price | -10% $88 | -5% $36 | +0% $-16 | +5% $-68 | +10% $-119 |
|---|---|---|---|---|---|
| Rent | -10% $-141 | -5% $-78 | +0% $-16 | +5% $47 | +10% $110 |
| Rate | -1.0pp $60 | -0.5pp $22 | base $-16 | +0.5pp $-55 | +1.0pp $-94 |
UW: 25.0% down · 7.5% · 30yr · 1.5% tax · 5.0% vac · 8.0% maint · 8.0% mgmt
Financing live
Cash to close
- Down payment
- $37,500
- Closing costs
- $4,500
- Reserves months
- —
- Total cash needed
- —
Loan-product check · same deal, 3 products live
Conventional
25% down · 7.5% · 30yr
- Down + closing
- —
- Monthly P&I
- —
- Monthly cashflow
- —
- DSCR
- —
- Eligible?
- —
Personal DTI + credit; lowest rate.
DSCR
20% down · 8.5% · 30yr
- Down + closing
- —
- Monthly P&I
- —
- Monthly cashflow
- —
- DSCR
- —
- Eligible?
- —
No personal income docs; deal must DSCR.
Hard money
10% down · 12.0% · 12mo
- Down + closing
- —
- Monthly P&I
- —
- Monthly cashflow
- —
- DSCR
- —
- Eligible?
- —
Short-term bridge; refi at stabilization.
Rent comps 17 comps
| Address | Beds | Baths | Sqft | Rent | $/sqft | DOM | Units | Dist |
|---|---|---|---|---|---|---|---|---|
| 51 Heritage Village Ln Unit 1 Columbia, SC | 2.0 | 2.0 | 1150 | $1,400 | $1.22 | 24d | 1 | 0.17mi |
| 14 Heritage Village Ln Columbia, SC | 2.0 | 2.0 | 1100 | $2,150 | $1.95 | 24d | 1 | 0.30mi |
| 171 Winding Chestnut Dr Columbia, SC | 3.0 | 2.5 | 1335 | $1,975 | $1.48 | 24d | 1 | 0.33mi |
| 801 Chinquapin Rd Columbia, SC | 1.0–2.0 | 1.0–1.5 | 729 | $1,200 | $1.64 | 4d | 7 | 0.36mi |
| 846 Piney Grove Rd Columbia, SC | 3.0 | 2.5 | 1400 | $1,495 | $1.07 | 24d | 1 | 0.49mi |
| 217 Wynn Way Unit B Columbia, SC | 2.0 | 1.5 | 1160 | $1,095 | $0.94 | 19d | 1 | 0.53mi |
| 135 Hunters Grove Dr Columbia, SC | 3.0 | 2.5 | 1428 | $1,595 | $1.12 | 22d | 1 | 0.65mi |
| 100 Fairforest Rd Columbia, SC | 2.0 | 1.5 | 1150 | $1,224 | $1.06 | 4d | 3 | 0.65mi |
| 121 Manorwood Ct Unit C Columbia, SC | 2.0 | 1.5 | 1120 | $1,095 | $0.98 | 24d | 1 | 0.66mi |
| 105 Manorwood Ct Columbia, SC | 2.0 | 1.5 | 1000 | $1,150 | $1.15 | 24d | 1 | 0.71mi |
| 1335 Cactus Ave Columbia, SC | 3.0 | 2.0 | 1155 | $1,450 | $1.26 | 15d | 1 | 0.76mi |
| 408 Foxfire Dr Columbia, SC | 1.0–3.0 | 1.0–2.0 | 1016 | $1,225 | $1.21 | 4d | 7 | 0.84mi |
| 500 Harbison Blvd Columbia, SC | 2.0–3.0 | 2.0–3.0 | 1152 | $1,849 | $1.61 | 3d | 11 | 0.90mi |
| 6 Forestgrove Ct Columbia, SC | 3.0 | 2.0 | 1066 | $1,599 | $1.50 | 22d | 1 | 1.12mi |
| 4248 Donavan Dr Columbia, SC | 3.0 | 2.0 | 1231 | $1,586 | $1.29 | 19d | 1 | 1.18mi |
| 1473 Haviland Cir Columbia, SC | 3.0 | 2.0 | 1425 | $1,499 | $1.05 | 12d | 1 | 1.31mi |
| 264 Piney Grove Rd Columbia, SC | 2.0 | 1.0 | 1100 | $1,250 | $1.14 | 24d | 1 | 1.36mi |
HOA detail
- Monthly dues
- $232 · $2,784/yr
Listing history 8 events
-
2026-06-18days on market $150,000 Active 10 DOM
-
2026-06-17days on market $150,000 Active 9 DOM
-
2026-06-16days on market $150,000 Active 8 DOM
-
2026-06-15days on market $150,000 Active 7 DOM
-
2026-06-14days on market $150,000 Active 5 DOM
-
2026-06-10days on market $150,000 Active 2 DOM
-
2026-06-09remarks 681-char remark
-
2026-06-09$150,000 Active 1 DOM
ⓘ Source: listings_history table (triggers on properties + properties_extension) + one-shot
backfill from property_details.listing_events for pre-trigger history.
Climate risk First Street
- Flood 1/10 Low FEMA zone X (unshaded) · 0% chance over 30 yrs
- Wildfire 3/10 Moderate
- Heat 6/10 Major 7 d/yr ≥108°F today · 16 d/yr by 30 yrs out
- Wind 6/10 Major 59% chance of damaging wind over 30 yrs
- Air quality 3/10 Moderate 2 unhealthy d/yr today · 3 by 30 yrs out
Nearby sold comps map
Loading sold comps map…
Walkable amenities ~0.75 mi
Loading nearby amenities…
Taxation est. · year 1
- Rental income
- $19,031
- − Mortgage interest
- −$8,402
- − Property taxes
- −$2,250
- − Insurance
- −$750
- − Repairs & maintenance
- −$1,523
- − Management
- −$1,523
- − HOA
- −$2,784
- − Depreciation
- −$4,364
- Taxable loss
- −$2,564
- Est. tax savings @ 24.0%
- +$615
- After-tax cash flow
- $427/yr
For passive investors: Depreciation is non-cash, so a rental often shows a tax loss while cash-flowing — sheltering income. Rental losses are passive: they offset passive income freely, and up to $25,000/yr can offset ordinary (W-2) income if you actively participate and your MAGI is under $100k (phasing out to $0 by $150k); unused losses carry forward. On sale, claimed depreciation is recaptured at up to 25%, and gains may owe capital-gains tax (a 1031 exchange can defer both). Figures are a year-1 estimate at your 24.0% rate — not tax advice; consult a CPA.
Condition & rehab AI · 13 photos
This charming townhouse is in good condition with a good condition score of 75. It has a modern kitchen, a primary suite with a private bath, and a well-maintained exterior. The property is ready for a fresh coat of paint and a new backsplash to further enhance its value.
Value-add opportunities
- Both Painting the exterior and interior walls — Fresh paint can enhance curb appeal and interior aesthetics, attracting more buyers and renters.
- Both Updating the kitchen backsplash — A new backsplash can modernize the kitchen and make it more appealing to potential buyers and renters.
Renovation cost estimate screening
Value-add ROI direction
- Both Painting the exterior and interior walls — Fresh paint can enhance curb appeal and interior aesthetics, attracting more buyers and renters. ↑
- Both Updating the kitchen backsplash — A new backsplash can modernize the kitchen and make it more appealing to potential buyers and renters. ↑
ⓘ Cost ranges are severity-bucket heuristics (US national rule-of-thumb). Get contractor quotes + a written scope before underwriting a rehab budget.
Schools (NCES district)
- District
- Richland 01
- NCES district ID
- 4503360
- Math proficiency
- 26% ▼ -7.00%
- Reading proficiency
- 36% ▼ -5.00%
- Median HH income
- $38,931
- Composite
- 25.94/100
- National rank
- #7335
- State rank
- #54 of 80 in SC
Livability — St. Andrews
No livability data for this city. (Only ~50 U.S. cities are tracked.)
Census & demographics
- Census place
- St. Andrews, SC
- County
- Lexington County · 232,571 people
- City population
- 40,504
- Metro
- Columbia, SC
- Population (ZIP)
- 27,657
- Household income
- $77,142
- Rent vs Own
- Severe rent burden
- 863.0
Population outlook (Richland County) Hauer SSP2
- Today (2025)
- 459,667 people
- By 2030
- 487,524 · +6.1%
- By 2040
- 542,035 · +17.9%
- By 2050
- 595,371 · +29.5%
- By 2075
- 732,998 · +59.5%
- By 2100
- 820,415 · +78.5%
Race, ethnicity, and origin ACS 2023
- Neighborhood character
- Majority White (63%)
- Race & ethnicity
- White 63% Black 25% Hispanic / Latino 5% Two or more races 4% Asian 3%
- Hispanic origin (detail)
- Mexican 2%
- Common ancestry
- Slovak 3% Italian 3% Serbian 3%
- Foreign-born
- 7% · Canada, China, Jamaica
- Languages at home
- 91% English-only · Spanish 4% Other Indo-European 1% Russian/Polish/Slavic 1%
Political lean MEDSL · Richland
- 2024 margin
- Solid D (+34.6) · D 66.4% · R 31.8% · Other 1.8%
- 2008→2024 swing
- +5.7pp toward D · 2008: 28.9pp · 2024: 34.6pp
- All cycles
- 2024: D+34.6 2020: D+38.3 2016: D+32.9 2012: D+33.3 2008: D+28.9
Not yet ingested
- Civics
- —
Market trends
- HPI YoY
- ▼ -139.55%
- Current HPI
- 212.5173
- Rent YoY
- ▼ -0.23%
- Metro
- Columbia, SC
- State GDP YoY
- ▲ 4.51%
- F500 in state
- 2
Industry mix (Fortune 500 HQ in SC)
| Industry | F500 HQs | Revenue |
|---|---|---|
| Packaging | 1 | $7B |
|
||
Price history
1 event — show timeline
- 2026-06-08 Listed $150,000 Consolidated MLS
Cash-flow waterfall
monthlySold comps — $/sqft
last 12 mo · ≤1 miLoading sold comps…