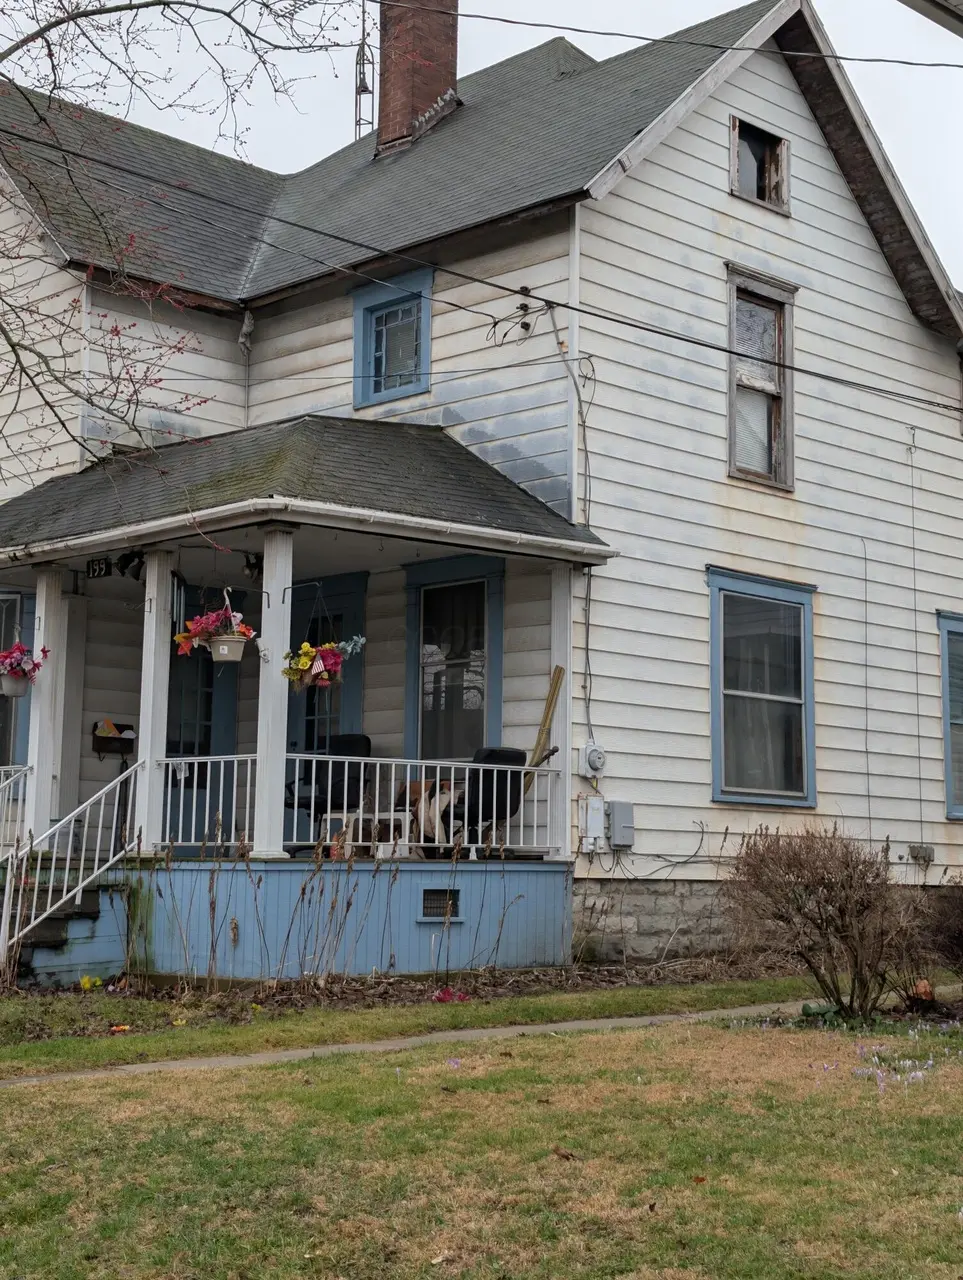
199 Olney Ave
Marion, OH 43302
$59,000B-
3 bd · 1.0 ba ·
2,536 sqft ·
Built 1881
· SingleFamily
· Active
· 61 DOM
Cashflow @ list (25.0% down · 7.5%)
Estimated rent
$1,556/mo
Mortgage (P&I)
−$309
Tax + insurance
−$111
HOA
−$0
Vac / Maint / Mgmt
−$327
Net cashflow
$809/mo
Annual
$9,703/yr
Cap rate
22.74%
Cash-on-cash
58.74%
DSCR
3.61
1% rule
2.64%
Cash to close
$16,520
Investor read
- This is a 3-bed/1.0-bath single-family listed at $59k.
- At list price, monthly cash flow is $809 ($10k/yr) — positive.
- The deal already cash-flows at list — no discount required.
- Meets the 1% rule at list price ($2k rent vs $59k).
- It's been on market 61 days — a 6% lower offer ($55k) is reasonable based on typical stale-listing flexibility.
- Recommended offer: $55k (6.0% below list) — sets the bar for market timing.
- Local home prices are declining (-3.0%/yr); year-one equity from $408 of loan paydown is wiped out by about $2k of value loss. Plan a longer hold.
- Location reads 65/100 on livability (#704 in OH) — a middle-class / working-renter tenant base. Strengths: cost of living A+, housing A+; Watch: schools D+, crime D+, amenities F.
- Marion City (town): math 22% / reading 31% proficiency, ranked #600 of 656 in OH (top 92%) — low school quality limits family demand, transient renter base, plan for 1-2y turnover; 67% free/reduced lunch — lower-income household profile, screen leases tightly.
- Watch-outs: built in 1881 — expect roof / HVAC / electrical / plumbing capex.
- Market conditions: 210 active listings in the ZIP; 53 units permitted in Marion County in 2024 (0 in 5+ unit buildings).
- Marion County population projected at -18% by 2050 — secular population decline; favor cash flow + early exit over multi-decade hold.
- 2 sale attempts; this cycle's ask has dropped $41k (41%) from the opening price — seller is motivated, your offer sets the floor, not the list.
- Current owner paid $48k; 24% above their basis — modest negotiation headroom, anchor on the comps not their cost.
- At projected returns (-3.0% appreciation + 3.0% rent growth), your $17k cash investment doubles in ~2 years — after that, you're playing with house money.
- Cap rate 22.7% vs local median 6.9% in Marion — top-decile yield for the area; either an underpriced asset or a hidden risk that comps aren't pricing in. Stress-test before assuming the spread holds.
- This rent runs 34% of the median local income ($55k/yr) — at the standard rent-burdened threshold; future hikes will face affordability resistance.
Questions for listing agent
- It's been on market 61 days. Have you received any prior offers? Is the seller open to a 6% concession, seller financing, or rate buy-down credit?
- Built in 1881 — when were the roof, HVAC, electrical panel, plumbing, and water heater last replaced?
- Why hasn't it sold? Are there any deal-killer items the seller is aware of (foundation, flood, title, zoning, code violations)?
- Is there a deadline driving the sale (1031 exchange, divorce, estate, relocation)? That informs how much negotiation room exists.
- Schools are D-rated, which usually means shorter tenancies and higher turnover. Who's the typical renter profile here, and what's been the actual vacancy rate?
- Crime grade is D in this area — have there been break-ins, vandalism, or insurance claims at this property in the last 3 years? What carrier currently insures it and at what premium?
- What's the average days-on-market for RENTAL listings here right now (not sales)? A rising rental-DOM trend means longer vacancies and softer asking-rent achievability than the comps imply.
- What's the recent tenant-quality profile in this submarket — average credit score on applications, eviction rate, late-payment / NSF rate, and stable-employment percentage? A property-management company in the area should have these aggregated.
CashFlowRE · CFR-Y5YFEAFNN7VAAY
· Data 6 days ago
cashflowre.app · 2026-05-29