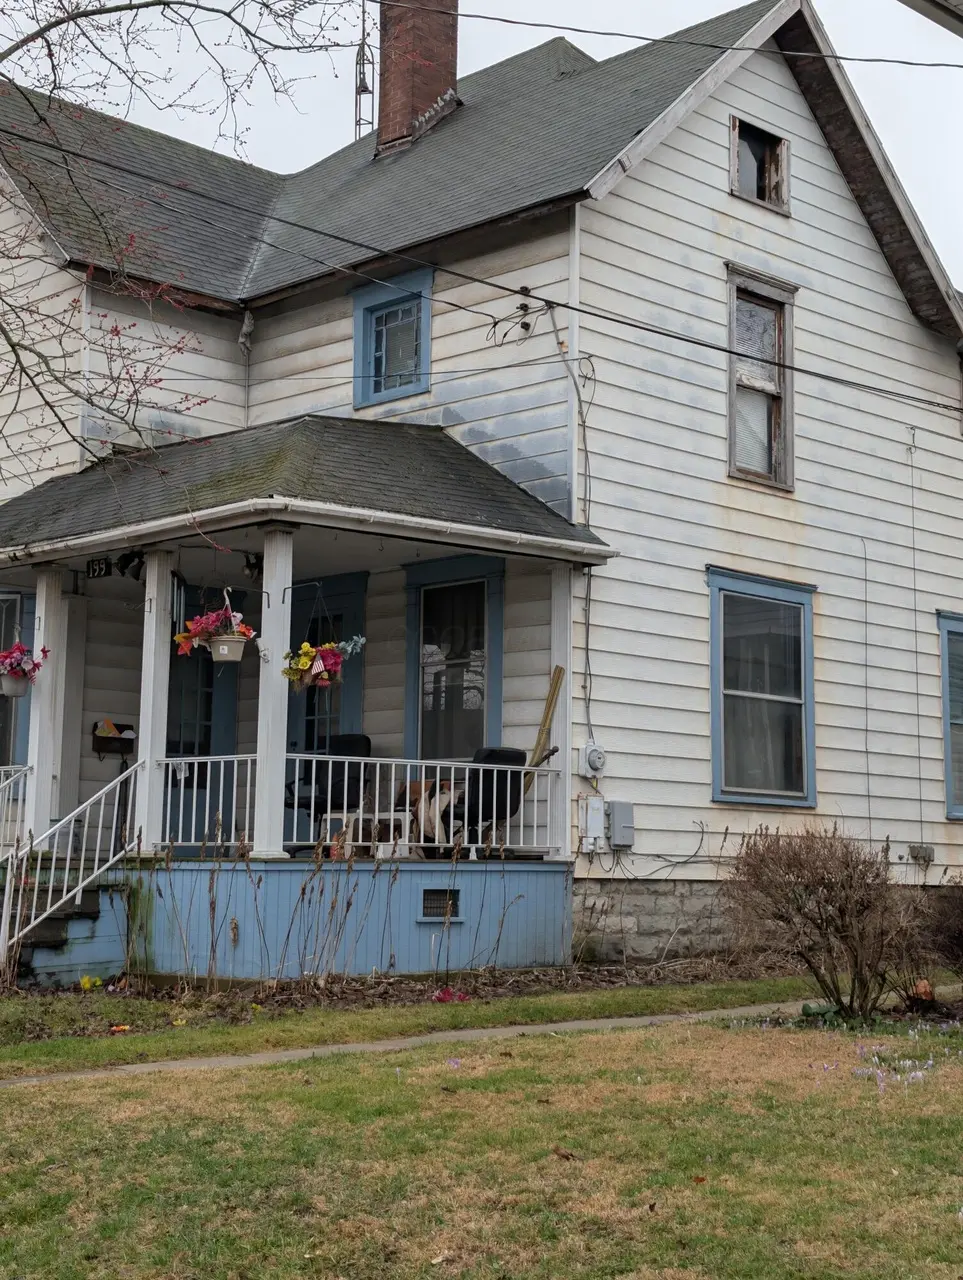
199 Olney Ave · Marion, OH
Flood risk 4/10 · Minor
- FEMA flood zone
- X (unshaded)
- Chance of flooding over 30 yrs
- 0.22%
- Est. flood insurance / yr
- $473 – $860
Fire risk 1/10 · Minimal
- Est. fire insurance / yr
- $713 – $1,323
Heat risk 3/10 · Minor
- Hot days now (above 100°F)
- 7 days/yr
- Hot days in 30 yrs
- 18 days/yr
Wind risk 2/10 · Minimal
- Chance of severe wind over 30 yrs
- —
Air-quality risk 2/10 · Minimal
- Unhealthy air days now
- 1 days/yr
- Unhealthy air days in 30 yrs
- 1 days/yr
Risk factors via First Street. Map © Google.
Why this score? — see what drove the B- grade
The composite is a weighted blend of 9 inputs, each scored 0–100. Each bar is that input's sub-score; the figure is the points it added to the 100-point composite (weight × sub-score).
- Cash flow +30.0/30.0
- 1% rule +10.0/10.0
- DSCR +10.0/10.0
- ARV discount +7.5/15.0
- Livability +3.2/5.0
- Rent growth +2.5/5.0
- Condition / age +2.5/5.0
- Schools +2.2/10.0
- Appreciation +0.0/10.0
$59,000
🖨 Deal sheet 📄 Offer letter ✓ Due diligence
Listing remarks MLS
POTENTIAL UNLIMITED: FLIP OR RESTORE! The Character: Incredible, stellar original woodwork throughout that commands attention and serves as a centerpiece for any renovation. The Scale: Exceptionally large floor plan with expansive rooms and a layout that invites creative reconfiguration. The Perks: Features both a detached garage and an additional shed, offering rare utility and storage options for this area. The Value: Exceptional 'After Repair Value' potential for those looking to build equity through restoration. being sold 'as is'
Key facts
- Expansive rooms
- Original woodwork
- Detached garage
Tags
Neighborhood map
What this means for you Summary
Snapshot
- This is a 3-bed/1.0-bath single-family listed at $59k.
Deal economics
- At list price, monthly cash flow is $809 ($10k/yr) — positive.
- The deal already cash-flows at list — no discount required.
- Meets the 1% rule at list price ($2k rent vs $59k).
- Recommended offer: $55k (6.0% below list) — sets the bar for market timing.
- Cap rate 22.7% vs local median 6.9% in Marion — top-decile yield for the area; either an underpriced asset or a hidden risk that comps aren't pricing in. Stress-test before assuming the spread holds.
Location & tenants
- Location reads 65/100 on livability (#704 in OH) — a middle-class / working-renter tenant base. Strengths: cost of living A+, housing A+; Watch: schools D+, crime D+, amenities F.
- Marion City (town): math 22% / reading 31% proficiency, ranked #600 of 656 in OH (top 92%) — low school quality limits family demand, transient renter base, plan for 1-2y turnover; 67% free/reduced lunch — lower-income household profile, screen leases tightly.
- Market conditions: 210 active listings in the ZIP; 53 units permitted in Marion County in 2024 (0 in 5+ unit buildings).
- This rent runs 34% of the median local income ($55k/yr) — at the standard rent-burdened threshold; future hikes will face affordability resistance.
Forward outlook
- Local home prices are declining (-3.0%/yr); year-one equity from $408 of loan paydown is wiped out by about $2k of value loss. Plan a longer hold.
- Marion County population projected at -18% by 2050 — secular population decline; favor cash flow + early exit over multi-decade hold.
- At projected returns (-3.0% appreciation + 3.0% rent growth), your $17k cash investment doubles in ~2 years — after that, you're playing with house money.
Negotiation context
- It's been on market 61 days — a 6% lower offer ($55k) is reasonable based on typical stale-listing flexibility.
- 2 sale attempts; this cycle's ask has dropped $41k (41%) from the opening price — seller is motivated, your offer sets the floor, not the list.
- Current owner paid $48k; 24% above their basis — modest negotiation headroom, anchor on the comps not their cost.
Risks & watch-outs
- Watch-outs: built in 1881 — expect roof / HVAC / electrical / plumbing capex.
Questions for the listing agent
- It's been on market 61 days. Have you received any prior offers? Is the seller open to a 6% concession, seller financing, or rate buy-down credit?
- Built in 1881 — when were the roof, HVAC, electrical panel, plumbing, and water heater last replaced?
- Why hasn't it sold? Are there any deal-killer items the seller is aware of (foundation, flood, title, zoning, code violations)?
- Is there a deadline driving the sale (1031 exchange, divorce, estate, relocation)? That informs how much negotiation room exists.
- Schools are D-rated, which usually means shorter tenancies and higher turnover. Who's the typical renter profile here, and what's been the actual vacancy rate?
- Crime grade is D in this area — have there been break-ins, vandalism, or insurance claims at this property in the last 3 years? What carrier currently insures it and at what premium?
- What's the average days-on-market for RENTAL listings here right now (not sales)? A rising rental-DOM trend means longer vacancies and softer asking-rent achievability than the comps imply.
- What's the recent tenant-quality profile in this submarket — average credit score on applications, eviction rate, late-payment / NSF rate, and stable-employment percentage? A property-management company in the area should have these aggregated.
- How much new for-sale + rental construction is in the pipeline within 1–3 miles? Heavy new supply typically softens prices + rents 12–24 months out; constrained supply supports both.
Investment metrics
- 1% rule
- 2.64% ✓
- Cap rate
- 22.74%
- Cash-on-cash
- 58.74%
- DSCR
- 3.61
- GRM
- 3.2
CMA / ARV
- ARV (median comp)
- $133,556
- List price
- $59,000
- Delta
- -55.82%
- Verdict
- UNDERPRICED
- Comps
- 20 within 1.0 mi
Show comp detail 12 sales within ~0.75 mi
| Address | Dist | Beds/Ba | Sqft | Sold | Price | $/sf | Match |
|---|---|---|---|---|---|---|---|
| 324 W Church St | 0.19mi | 4/2.0 (+1) | 2,280 (-10%) | 1mo | $212,500 | $93 | 64 |
| 395 W Church St | 0.08mi | 3/2.0 | 2,288 (-10%) | 16mo | $280,000 | $122 | 63 |
| 254 S State St | 0.60mi | 4/2.0 (+1) | 2,560 (+1%) | 8mo | $140,000 | $55 | 55 |
| 593 Windsor St | 0.58mi | 3/2.0 | 2,282 (-10%) | 1mo | $235,000 | $103 | 51 |
| 389 S Prospect St | 0.48mi | 4/2.0 (+1) | 2,280 (-10%) | 2mo | $196,000 | $86 | 50 |
| 589 Pearl St | 0.65mi | 3/2.0 | 2,575 (+2%) | 17mo | $130,000 | $50 | 49 |
| 541 Pearl St | 0.59mi | 3/1.5 | 2,746 (+8%) | 11mo | $73,500 | $27 | 47 |
| 307 Silver St | 0.47mi | 4/1.5 (+1) | 2,310 (-9%) | 20mo | $53,000 | $23 | 40 |
| 301 S Vine St | 0.73mi | 4/1.5 (+1) | 2,754 (+9%) | 7mo | $199,999 | $73 | 39 |
| 395 N Main St | 0.73mi | 4/2.0 (+1) | 2,767 (+9%) | 6mo | $120,000 | $43 | 37 |
| 369 Bellefontaine Ave | 0.53mi | 4/2.5 (+1) | 2,772 (+9%) | 19mo | $300,000 | $108 | 33 |
| 639 Pearl St | 0.71mi | 4/2.5 (+1) | 2,180 (-14%) | 11mo | $233,500 | $107 | 24 |
Match score weights: distance 35% · size 25% · config 20% · recency 20%. Top-matched comps best support the ARV.
Projected returns pro-forma
-3.0% appreciation · 3.0% rent growth · sell at horizon
- IRR
- 57.4%
- Equity multiple
- 3.54×
- Total profit
- $41,972
- Equity at exit
- $8,797
- IRR
- 62.3%
- Equity multiple
- 7.23×
- Total profit
- $102,991
- Equity at exit
- $5,101
Cash invested: $16,520 (down + closing). Projections, not guarantees.
Landlord ↔ Tenant lean methodology
- Overall (STATE)
- 73 Landlord-Friendly
- State Ohio
- 73 Landlord-Friendly · R+6
- County
- — inherits STATE
- City
- — inherits STATE
ZIP-level market 43302
- Home prices YoY
- -33.9%
- Active inventory
- 210
- Price-to-rent
- 3.2×
Monthly cashflow live
- Estimated rent
- $1,556 medium interval (Pro) →
- Mortgage (P&I)
- −$309
- Tax from tax record
- −$86 /mo · $1,036/yr
- Insurance
- −$25
- HOA
- −$0
- Vacancy / Maint / Mgmt
- −$327
- Net cashflow
- $809
Break-even live
UW: 25.0% down · 7.5% · 30yr · 1.5% tax · 5.0% vac · 8.0% maint · 8.0% mgmt
Financing live
Cash to close
- Down payment
- $14,750
- Closing costs
- $1,770
- Reserves months
- —
- Total cash needed
- —
Loan-product check · same deal, 3 products live
Conventional
25% down · 7.5% · 30yr
- Down + closing
- —
- Monthly P&I
- —
- Monthly cashflow
- —
- DSCR
- —
- Eligible?
- —
Personal DTI + credit; lowest rate.
DSCR
20% down · 8.5% · 30yr
- Down + closing
- —
- Monthly P&I
- —
- Monthly cashflow
- —
- DSCR
- —
- Eligible?
- —
No personal income docs; deal must DSCR.
Hard money
10% down · 12.0% · 12mo
- Down + closing
- —
- Monthly P&I
- —
- Monthly cashflow
- —
- DSCR
- —
- Eligible?
- —
Short-term bridge; refi at stabilization.
Listing history 9 events
-
2026-06-14days on market $59,000 Active 61 DOM
-
2026-06-12statusdays on market $59,000 Active 60 DOM
-
2026-05-05status Pending 543-char remark
Show marketing remark (543 chars)
POTENTIAL UNLIMITED: FLIP OR RESTORE! The Character: Incredible, stellar original woodwork throughout that commands attention and serves as a centerpiece for any renovation. The Scale: Exceptionally large floor plan with expansive rooms and a layout that invites creative reconfiguration. The Perks: Features both a detached garage and an additional shed, offering rare utility and storage options for this area. The Value: Exceptional 'After Repair Value' potential for those looking to build equity through restoration. being sold 'as is'
-
2026-04-16price $59,000 543-char remark
Show marketing remark (543 chars)
POTENTIAL UNLIMITED: FLIP OR RESTORE! The Character: Incredible, stellar original woodwork throughout that commands attention and serves as a centerpiece for any renovation. The Scale: Exceptionally large floor plan with expansive rooms and a layout that invites creative reconfiguration. The Perks: Features both a detached garage and an additional shed, offering rare utility and storage options for this area. The Value: Exceptional 'After Repair Value' potential for those looking to build equity through restoration. being sold 'as is'
-
2026-03-16price $84,000 543-char remark
Show marketing remark (543 chars)
POTENTIAL UNLIMITED: FLIP OR RESTORE! The Character: Incredible, stellar original woodwork throughout that commands attention and serves as a centerpiece for any renovation. The Scale: Exceptionally large floor plan with expansive rooms and a layout that invites creative reconfiguration. The Perks: Features both a detached garage and an additional shed, offering rare utility and storage options for this area. The Value: Exceptional 'After Repair Value' potential for those looking to build equity through restoration. being sold 'as is'
-
2026-03-08$99,999 Active 543-char remark
Show marketing remark (543 chars)
POTENTIAL UNLIMITED: FLIP OR RESTORE! The Character: Incredible, stellar original woodwork throughout that commands attention and serves as a centerpiece for any renovation. The Scale: Exceptionally large floor plan with expansive rooms and a layout that invites creative reconfiguration. The Perks: Features both a detached garage and an additional shed, offering rare utility and storage options for this area. The Value: Exceptional 'After Repair Value' potential for those looking to build equity through restoration. being sold 'as is'
-
2025-06-24soldstatus $47,500
-
2025-05-15status Pending
-
2025-05-09$79,900 Active
ⓘ Source: listings_history table (triggers on properties + properties_extension) + one-shot
backfill from property_details.listing_events for pre-trigger history.
Tax reassessment forecast OH · Partial reset (capped growth)
- Current annual tax
- $1,036 · $86/mo
- Projected year-2 tax
- $1,036 · $86/mo
- Expected delta
- $0/yr ($0/mo · 0.0%)
ⓘ Screening estimate from a state-policy table — verify with the county assessor before closing.
Climate risk First Street
- Flood 4/10 Moderate FEMA zone X (unshaded) · 22% chance over 30 yrs
- Wildfire 1/10 Low
- Heat 3/10 Moderate 7 d/yr ≥100°F today · 18 d/yr by 30 yrs out
- Wind 2/10 Low
- Air quality 2/10 Low 1 unhealthy d/yr today · 1 by 30 yrs out
Nearby sold comps map
Loading sold comps map…
Walkable amenities ~0.75 mi
Loading nearby amenities…
Taxation est. · year 1
- Rental income
- $18,667
- − Mortgage interest
- −$3,305
- − Property taxes
- −$1,036
- − Insurance
- −$295
- − Repairs & maintenance
- −$1,493
- − Management
- −$1,493
- − Depreciation
- −$1,716
- Taxable income
- $9,328
- Est. tax owed @ 24.0%
- −$2,239
- After-tax cash flow
- $7,465/yr
For passive investors: Depreciation is non-cash, so a rental often shows a tax loss while cash-flowing — sheltering income. Rental losses are passive: they offset passive income freely, and up to $25,000/yr can offset ordinary (W-2) income if you actively participate and your MAGI is under $100k (phasing out to $0 by $150k); unused losses carry forward. On sale, claimed depreciation is recaptured at up to 25%, and gains may owe capital-gains tax (a 1031 exchange can defer both). Figures are a year-1 estimate at your 24.0% rate — not tax advice; consult a CPA.
Schools (NCES district)
- District
- Marion City
- NCES district ID
- 3904433
- Math proficiency
- 22% ▼ -17.00%
- Reading proficiency
- 31% ▼ -8.00%
- Median HH income
- $32,327
- Composite
- 21.58/100
- National rank
- #8306
- State rank
- #600 of 656 in OH
Livability — Marion
- Score
- 65/100
- State rank
- #704
- US rank
- #12605
Category grades
Schools grade is shown separately in the Schools card above.
Census & demographics
- Census place
- Marion, OH
- County
- Marion County · 53,702 people
- City population
- 53,702
- Metro
- Marion, OH
- Population (ZIP)
- 53,702
- Household income
- $55,057
- Rent vs Own
- Severe rent burden
- 1554.0
Population outlook (Marion County) Hauer SSP2
- Today (2025)
- 62,078 people
- By 2030
- 60,049 · -3.3%
- By 2040
- 55,413 · -10.7%
- By 2050
- 50,604 · -18.5%
- By 2075
- 40,162 · -35.3%
- By 2100
- 29,105 · -53.1%
Race, ethnicity, and origin ACS 2023
- Neighborhood character
- Predominantly White (85%)
- Race & ethnicity
- White 85% Black 6% Two or more races 6% Hispanic / Latino 3%
- Common ancestry
- Slovak 2% Romanian 2% Lithuanian 2%
- Foreign-born
- 2% · Canada
- Languages at home
- 96% English-only · Spanish 2% Arabic 1%
Political lean MEDSL · Marion
- 2024 margin
- Solid R (+41.4) · D 28.9% · R 70.3%
- 2008→2024 swing
- -32.5pp toward R · 2008: -8.9pp · 2024: -41.4pp
- All cycles
- 2024: R+41.4 2020: R+38.6 2016: R+34.4 2012: R+7.6 2008: R+8.9
Not yet ingested
- Civics
- —
Market trends
- HPI YoY
- ▼ -114.52%
- Current HPI
- 223.5344
- Rent YoY
- —
- Metro
- Marion, OH
- State GDP YoY
- ▲ 1.98%
- F500 in state
- 48
Industry mix (Fortune 500 HQ in OH)
| Industry | F500 HQs | Revenue |
|---|---|---|
| Insurance | 3 | $145B |
|
||
| Industrial Machinery | 3 | $49B |
|
||
| Financial Services | 3 | $24B |
|
||
| Consumer Goods | 2 | $93B |
|
||
| Aerospace / Defense | 2 | $47B |
|
||
| Utilities | 2 | $33B |
|
||
Price history
-26.2% since first listed7 events — show timeline
- 2026-05-05 Pending — CBRMLS
- 2026-04-16 Price Changed $59,000 CBRMLS
- 2026-03-16 Price Changed $84,000 CBRMLS
- 2026-03-08 Listed $99,999 CBRMLS
- 2025-06-24 Sold (Public Records) $47,500 Public Records
- 2025-05-15 Pending — CBRMLS
- 2025-05-09 Listed $79,900 CBRMLS
Property tax history
+8.5%/yrLatest (2025): $1,036 · +0.0% YoY. Source: county tax records.
Cash-flow waterfall
monthlySold comps — $/sqft
last 12 mo · ≤1 miLoading sold comps…