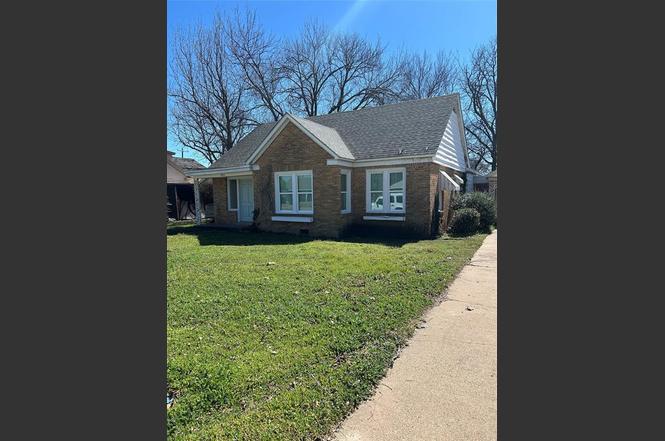
903 W Main St
Olney, TX 76374
$138,000C
3 bd · 2.0 ba ·
1,954 sqft ·
Built 1950
· SingleFamily
· Pending
· 31 DOM
Cashflow @ list (25.0% down · 7.5%)
Estimated rent
$1,285/mo
Mortgage (P&I)
−$724
Tax + insurance
−$196
HOA
−$0
Vac / Maint / Mgmt
−$270
Net cashflow
$95/mo
Annual
$1,145/yr
Cap rate
7.12%
Cash-on-cash
2.96%
DSCR
1.13
1% rule
0.93%
Cash to close
$38,640
Investor read
- This is a 3-bed/2.0-bath single-family listed at $138k.
- At list price, monthly cash flow is $95 ($1k/yr) — positive.
- The deal already cash-flows at list — no discount required.
- To meet the 1% rule (rent ≥ 1% of price), the offer needs to be $129k (6.9% below list).
- It's been on market 31 days — a 3% lower offer ($134k) is reasonable based on typical stale-listing flexibility.
- Recommended offer: $129k (6.9% below list) — sets the bar for 1% rule.
- Local home prices are declining (-2.0%/yr); year-one equity from $954 of loan paydown is wiped out by about $3k of value loss. Plan a longer hold.
- Location reads 67/100 on livability (#557 in TX) — a middle-class / working-renter tenant base. Strengths: crime A+, cost of living A+, housing A+; Watch: health & safety C-, amenities F, commute F.
- Olney ISD (town): math 50% / reading 56% proficiency, ranked #150 of 826 in TX (top 18%) — acceptable for families but not a draw, mixed tenant base, ~2y average lease; 60% free/reduced lunch — lower-income household profile, screen leases tightly.
- Zoned schools: Olney El (math 27% / reading 52%, grade F, #1,545 of 4,322 statewide, top 38%, 363 students, 64% FRL) — zoned schools at 64% FRL track the district average.
- Zoned-school proficiency averages 40% at this address vs 53% district-wide (-14 pts) — the specific schools serving this property underperform the Olney ISD average; the district grade overstates school quality for this exact location.
- Watch-outs: built in 1950 — expect roof / HVAC / electrical / plumbing capex.
- Market conditions: 29 active listings in the ZIP; 5 units permitted in Young County in 2024 (0 in 5+ unit buildings).
- Young County population projected to shrink 7% by 2050 — rents likely to lag national; underwrite the cash flow, not the appreciation.
- 2 sale attempts with the ask held roughly flat each time — persistent listings suggest the price (not the market) is what's stuck; bring a comps-based counter.
- Climate carrying-cost: severe wildfire risk; extreme-heat days projected 7→20/yr by 2055 (HVAC capex compounding) — expect insurance premiums to compound above CPI over the hold.
Questions for listing agent
- It's been on market 31 days. Have you received any prior offers? Is the seller open to a 7% concession, seller financing, or rate buy-down credit?
- Built in 1950 — when were the roof, HVAC, electrical panel, plumbing, and water heater last replaced?
- Is there a deadline driving the sale (1031 exchange, divorce, estate, relocation)? That informs how much negotiation room exists.
- Schools are B-rated — typically a magnet for longer-tenancy family renters. What's the average tenant stay here, and is there a school-zone premium baked into asking?
- What's the average days-on-market for RENTAL listings here right now (not sales)? A rising rental-DOM trend means longer vacancies and softer asking-rent achievability than the comps imply.
- What's the recent tenant-quality profile in this submarket — average credit score on applications, eviction rate, late-payment / NSF rate, and stable-employment percentage? A property-management company in the area should have these aggregated.
- How much new for-sale + rental construction is in the pipeline within 1–3 miles? Heavy new supply typically softens prices + rents 12–24 months out; constrained supply supports both.
CashFlowRE · CFR-Y66ABJCWC6RRXP
· Data 3 weeks ago
cashflowre.app · 2026-05-29