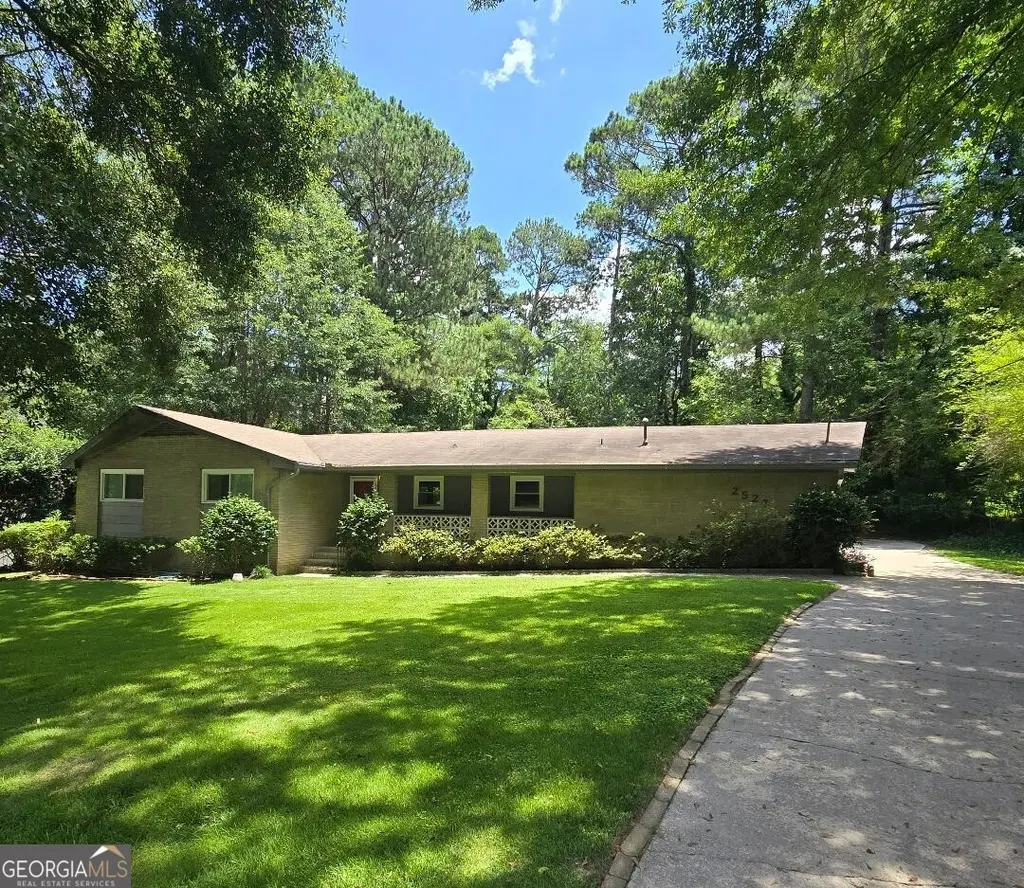
2527 Amalfi Dr
Lakeview Estates, GA 30012
$259,900B-
3 bd · 2.0 ba ·
1,873 sqft ·
Built 1965
· SingleFamily
· Under Contract
· 10 DOM
Cashflow @ list (25.0% down · 7.5%)
Estimated rent
$3,125/mo
Mortgage (P&I)
−$1,363
Tax + insurance
−$275
HOA
−$24
Vac / Maint / Mgmt
−$656
Net cashflow
$808/mo
Annual
$9,690/yr
Cap rate
10.02%
Cash-on-cash
13.32%
DSCR
1.59
1% rule
1.20%
Cash to close
$72,772
Investor read
- This is a 3-bed/2.0-bath single-family listed at $260k.
- At list price, monthly cash flow is $808 ($10k/yr) — positive.
- The deal already cash-flows at list — no discount required.
- Meets the 1% rule at list price ($3k rent vs $260k).
- Only 10 days on market — expect competitive offers; lowballing is unlikely to land.
- Local home prices are declining (-3.0%/yr); year-one equity from $2k of loan paydown is wiped out by about $8k of value loss. Plan a longer hold.
- Location reads 57/100 on livability (#475 in GA) — a working-class tenant base; expect higher turnover. Strengths: cost of living A+, housing A+, crime A-; Watch: amenities F, commute F, employment D-.
- Rockdale County (suburban): math 14% / reading 29% proficiency, ranked #136 of 174 in GA (top 78%) — low school quality limits family demand, transient renter base, plan for 1-2y turnover.
- Zoned schools: House Elementary School (math 8% / reading 18%, grade F, #1,031 of 1,228 statewide, top 84%, 599 students, 82% FRL) — zoned schools average 82% FRL vs 60% district-wide (23 pts higher); higher-poverty schools than district average — tighter screening recommended.
- Market conditions: Rents flat; 278 active listings in the ZIP; 3 comparable units currently listed for rent nearby; rentals leasing fast (median 0d on market — plan ~1-2 weeks tenant-placement turnaround); 483 units permitted in Rockdale County in 2024 (0 in 5+ unit buildings).
- Rockdale County population projected at +29% by 2050 — long-run rental-demand tailwind backs the buy-and-hold thesis.
- 8 sale attempts since 13y ago with the ask held roughly flat each time — persistent listings suggest the price (not the market) is what's stuck; bring a comps-based counter.
- Current owner paid $70k; list at $260k implies a 274% gain — meaningful room to come down on a strong offer.
- Climate carrying-cost: major wind risk, 27% chance of damaging wind over 30y; extreme-heat days projected 7→18/yr by 2055 (HVAC capex compounding) — expect insurance premiums to compound above CPI over the hold.
- Cap rate 10.0% vs local median 4.6% in Lakeview Estates — top-decile yield for the area; either an underpriced asset or a hidden risk that comps aren't pricing in. Stress-test before assuming the spread holds.
- At $3,125/mo this rent would consume 57% of the median local household income ($66k/yr) (locally 986% of renters already pay >50% of income on rent) — very limited rent-growth headroom before tenants either downsize or default.
Questions for listing agent
- Built in 1965 — when were the roof, HVAC, electrical panel, plumbing, and water heater last replaced?
- What does the HOA fee cover, when was the last increase, and are there any pending special assessments or reserve-fund shortfalls?
- Is there a deadline driving the sale (1031 exchange, divorce, estate, relocation)? That informs how much negotiation room exists.
- Schools are F-rated, which usually means shorter tenancies and higher turnover. Who's the typical renter profile here, and what's been the actual vacancy rate?
- What's the average days-on-market for RENTAL listings here right now (not sales)? A rising rental-DOM trend means longer vacancies and softer asking-rent achievability than the comps imply.
- What's the recent tenant-quality profile in this submarket — average credit score on applications, eviction rate, late-payment / NSF rate, and stable-employment percentage? A property-management company in the area should have these aggregated.
- How much new for-sale + rental construction is in the pipeline within 1–3 miles? Heavy new supply typically softens prices + rents 12–24 months out; constrained supply supports both.
CashFlowRE · CFR-YA19YH9J9261W2
· Data 3 weeks ago
cashflowre.app · 2026-05-29