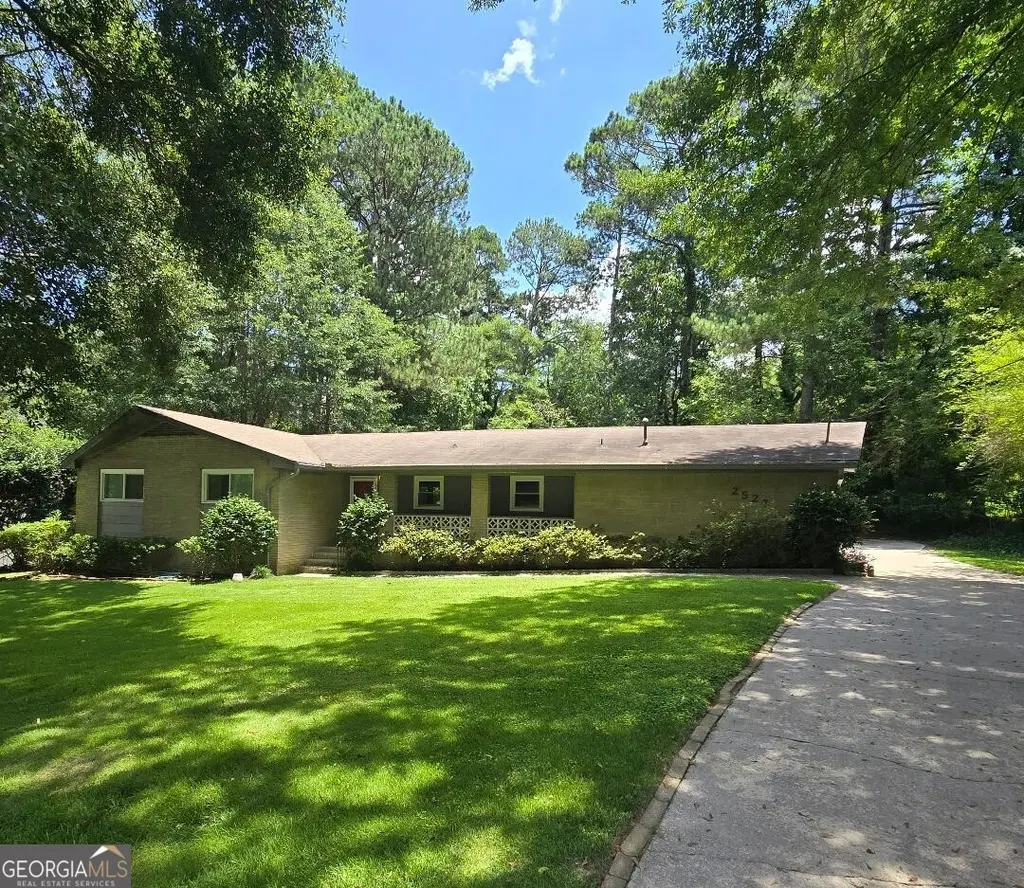
2527 Amalfi Dr · Lakeview Estates, GA
Flood risk 1/10 · Minimal
- FEMA flood zone
- X (unshaded)
- Chance of flooding over 30 yrs
- 0.0%
- Est. flood insurance / yr
- $507 – $1,088
Fire risk 3/10 · Minor
- Est. fire insurance / yr
- $963 – $1,789
Heat risk 5/10 · Moderate
- Hot days now (above 105°F)
- 7 days/yr
- Hot days in 30 yrs
- 18 days/yr
Wind risk 6/10 · Moderate
- Chance of severe wind over 30 yrs
- 27.0%
Air-quality risk 5/10 · Moderate
- Unhealthy air days now
- 7 days/yr
- Unhealthy air days in 30 yrs
- 10 days/yr
Risk factors via First Street. Map © Google.
Why this score? — see what drove the B- grade
The composite is a weighted blend of 9 inputs, each scored 0–100. Each bar is that input's sub-score; the figure is the points it added to the 100-point composite (weight × sub-score).
- Cash flow +28.0/30.0
- ARV discount +10.5/15.0
- DSCR +9.9/10.0
- 1% rule +7.0/10.0
- Livability +2.9/5.0
- Rent growth +2.6/5.0
- Condition / age +2.5/5.0
- Schools +1.9/10.0
- Appreciation +0.0/10.0
$259,900
🖨 Deal sheet (PDF) 📄 Offer letter ✓ Due diligence
Listing remarks
One level. Brick. Hardwood floors that are actually hardwood. This is the kind of house people regret passing on. It sits on a real lot with mature trees and a long driveway that makes everyday living easy. No stairs to deal with. No awkward layout. Just solid construction and space that works. The living areas are generous. The windows are big. Light comes in the way it should. The kitchen connects naturally to dining and living so you are not cut off from everything while cooking. The bathroom is original. Clean. Functional. If you want to update it, you can. If you do not, it works as-is. This is not a cosmetic flip. It is a strong house with good bones and room to make it your own witho
Key facts
- Big windows
- Original bathroom
- Long driveway
Tags
Property features AI
Finance
- Other: Listing accepts Cash, Conventional, FHA, and VA financing
- HOA & community: Homeowners association with $285 periodic fee (fee covers other items); Community clubhouse; Community lake; Playground; Tennis courts; Near public transport
Exterior
- Parking: Open parking; Parking pad with side/rear entrance at kitchen level
- Utilities: Public water; Septic sewer; Other utilities
- Home design: Single family residence; One level; Resale property
- Construction: Built in 1965; Brick construction; Composition roof; Crawl space foundation
- Exterior features: Level, private lot; Composition roof; Brick exterior
Interior
- Kitchen: Dishwasher; Microwave; Refrigerator; Ice maker; Tankless water heater
- Bedrooms: 4 bedrooms on the main level
- Flooring: Carpet; Hardwood
- Bathrooms: 3 full bathrooms on the main level
- Heating & cooling: Central heating with forced air (natural gas); Central air conditioning (electric); Ceiling fans
- Interior features: Bookcases; Walk-in closets
- Laundry & utility: Washer and dryer included; Laundry room; Other laundry feature
Neighborhood map
What this means for you Summary
Snapshot
- This is a 3-bed/2.0-bath single-family listed at $260k.
Deal economics
- At list price, monthly cash flow is $808 ($10k/yr) — positive.
- The deal already cash-flows at list — no discount required.
- Meets the 1% rule at list price ($3k rent vs $260k).
- Cap rate 10.0% vs local median 4.6% in Lakeview Estates — top-decile yield for the area; either an underpriced asset or a hidden risk that comps aren't pricing in. Stress-test before assuming the spread holds.
Location & tenants
- Location reads 57/100 on livability (#475 in GA) — a working-class tenant base; expect higher turnover. Strengths: cost of living A+, housing A+, crime A-; Watch: amenities F, commute F, employment D-.
- Rockdale County (suburban): math 14% / reading 29% proficiency, ranked #136 of 174 in GA (top 78%) — low school quality limits family demand, transient renter base, plan for 1-2y turnover.
- Zoned schools: House Elementary School (math 8% / reading 18%, grade F, #1,031 of 1,228 statewide, top 84%, 599 students, 82% FRL) — zoned schools average 82% FRL vs 60% district-wide (23 pts higher); higher-poverty schools than district average — tighter screening recommended.
- Market conditions: Rents flat; 278 active listings in the ZIP; 3 comparable units currently listed for rent nearby; rentals leasing fast (median 0d on market — plan ~1-2 weeks tenant-placement turnaround); 483 units permitted in Rockdale County in 2024 (0 in 5+ unit buildings).
- At $3,125/mo this rent would consume 57% of the median local household income ($66k/yr) (locally 986% of renters already pay >50% of income on rent) — very limited rent-growth headroom before tenants either downsize or default.
Forward outlook
- Local home prices are declining (-3.0%/yr); year-one equity from $2k of loan paydown is wiped out by about $8k of value loss. Plan a longer hold.
- Rockdale County population projected at +29% by 2050 — long-run rental-demand tailwind backs the buy-and-hold thesis.
Negotiation context
- Only 10 days on market — expect competitive offers; lowballing is unlikely to land.
- 8 sale attempts since 13y ago with the ask held roughly flat each time — persistent listings suggest the price (not the market) is what's stuck; bring a comps-based counter.
- Current owner paid $70k; list at $260k implies a 274% gain — meaningful room to come down on a strong offer.
Risks & watch-outs
- Climate carrying-cost: major wind risk, 27% chance of damaging wind over 30y; extreme-heat days projected 7→18/yr by 2055 (HVAC capex compounding) — expect insurance premiums to compound above CPI over the hold.
Questions for the listing agent
- Built in 1965 — when were the roof, HVAC, electrical panel, plumbing, and water heater last replaced?
- What does the HOA fee cover, when was the last increase, and are there any pending special assessments or reserve-fund shortfalls?
- Is there a deadline driving the sale (1031 exchange, divorce, estate, relocation)? That informs how much negotiation room exists.
- Schools are F-rated, which usually means shorter tenancies and higher turnover. Who's the typical renter profile here, and what's been the actual vacancy rate?
- What's the average days-on-market for RENTAL listings here right now (not sales)? A rising rental-DOM trend means longer vacancies and softer asking-rent achievability than the comps imply.
- What's the recent tenant-quality profile in this submarket — average credit score on applications, eviction rate, late-payment / NSF rate, and stable-employment percentage? A property-management company in the area should have these aggregated.
- How much new for-sale + rental construction is in the pipeline within 1–3 miles? Heavy new supply typically softens prices + rents 12–24 months out; constrained supply supports both.
Investment metrics
- 1% rule
- 1.20% ✓
- Cap rate
- 10.02%
- Cash-on-cash
- 13.32%
- DSCR
- 1.59
- GRM
- 6.9
CMA / ARV
- ARV (median comp)
- $278,625
- List price
- $259,900
- Delta
- -6.72%
- Verdict
- FAIR
- Comps
- 20 within 1.0 mi
Show comp detail 12 sales within ~0.75 mi
| Address | Dist | Beds/Ba | Sqft | Sold | Price | $/sf | Match |
|---|---|---|---|---|---|---|---|
| 2533 Amalfi Dr | 0.06mi | 3/2.5 | 1,739 (-7%) | 1mo | $269,999 | $155 | 83 |
| 2519 Paces Landing Dr NW | 0.21mi | 3/2.0 | 1,850 (-1%) | 21mo | $280,000 | $151 | 70 |
| 2586 Lake Capri Dr | 0.24mi | 3/2.0 | 2,037 (+9%) | 7mo | $270,000 | $133 | 69 |
| 2786 Westminister Ln NW | 0.27mi | 3/2.0 | 1,792 (-4%) | 17mo | $270,000 | $151 | 66 |
| 2511 Amalfi Dr | 0.10mi | 3/2.5 | 1,996 (+7%) | 22mo | $300,000 | $150 | 64 |
| 2738 Westminister Ln NW | 0.33mi | 3/2.0 | 1,707 (-9%) | 11mo | $250,000 | $146 | 61 |
| 2721 Westminister Ln NW | 0.41mi | 3/2.0 | 1,940 (+4%) | 17mo | $319,000 | $164 | 61 |
| 2091 Napoli Cir | 0.37mi | 3/2.5 | 1,659 (-11%) | 2mo | $345,000 | $208 | 60 |
| 2737 Westminister Ln NW | 0.34mi | 4/3.0 (+1) | 1,621 (-14%) | 7mo | $275,000 | $170 | 47 |
| 2039 Monterey Dr | 0.63mi | 4/3.0 (+1) | 1,860 (-1%) | 23mo | $360,000 | $194 | 42 |
| 2300 Frontier Dr NW | 0.68mi | 3/2.0 | 2,045 (+9%) | 18mo | $57,000 | $28 | 38 |
| 2975 Riviera Dr NW | 0.67mi | 3/2.0 | 2,112 (+13%) | 18mo | $254,000 | $120 | 33 |
Match score weights: distance 35% · size 25% · config 20% · recency 20%. Top-matched comps best support the ARV.
Projected returns pro-forma
-3.0% appreciation · 0.39% rent growth · sell at horizon
- IRR
- 0.5%
- Equity multiple
- 1.02×
- Total profit
- $1,283
- Equity at exit
- $38,752
- IRR
- 7.4%
- Equity multiple
- 1.50×
- Total profit
- $36,048
- Equity at exit
- $22,471
Cash invested: $72,772 (down + closing). Projections, not guarantees.
Landlord ↔ Tenant lean methodology
- Overall (STATE)
- 90 Strongly Landlord-Friendly
- State Georgia
- 90 Strongly Landlord-Friendly · R+3
- County
- — inherits STATE
- City
- — inherits STATE
ZIP-level market 30012
- Rents YoY
- 0.4%
- Active inventory
- 278
- Price-to-rent
- 6.9×
Monthly cashflow live
- Estimated rent
- $3,125 medium interval (Pro) →
- Mortgage (P&I)
- −$1,363
- Tax from tax record
- −$166 /mo · $1,995/yr
- Insurance
- −$108
- HOA
- −$24
- Vacancy / Maint / Mgmt
- −$656
- Net cashflow
- $808
Break-even live
Sensitivity live
| Price | -10% $955 | -5% $881 | +0% $808 | +5% $734 | +10% $660 |
|---|---|---|---|---|---|
| Rent | -10% $561 | -5% $684 | +0% $808 | +5% $931 | +10% $1,054 |
| Rate | -1.0pp $938 | -0.5pp $874 | base $808 | +0.5pp $740 | +1.0pp $672 |
UW: 25.0% down · 7.5% · 30yr · 1.5% tax · 5.0% vac · 8.0% maint · 8.0% mgmt
Financing live
Cash to close
- Down payment
- $64,975
- Closing costs
- $7,797
- Reserves months
- —
- Total cash needed
- —
Loan-product check · same deal, 3 products live
Conventional
25% down · 7.5% · 30yr
- Down + closing
- —
- Monthly P&I
- —
- Monthly cashflow
- —
- DSCR
- —
- Eligible?
- —
Personal DTI + credit; lowest rate.
DSCR
20% down · 8.5% · 30yr
- Down + closing
- —
- Monthly P&I
- —
- Monthly cashflow
- —
- DSCR
- —
- Eligible?
- —
No personal income docs; deal must DSCR.
Hard money
10% down · 12.0% · 12mo
- Down + closing
- —
- Monthly P&I
- —
- Monthly cashflow
- —
- DSCR
- —
- Eligible?
- —
Short-term bridge; refi at stabilization.
Rent comps 3 comps
| Address | Beds | Baths | Sqft | Rent | $/sqft | DOM | Units | Dist |
|---|---|---|---|---|---|---|---|---|
| 2500 Rockbridge Rd NW Unit 1569851P Conyers, GA | 4.0 | 3.0 | 2594 | $5,224 | $2.01 | 3d | 1 | 0.47mi |
| 2902 Barcelona Way Conyers, GA | 4.0 | 2.5 | 2510 | $2,056 | $0.82 | 0d | 1 | 0.61mi |
| 2243 Mason Pt Lithonia, GA | 4.0 | 3.0 | 2588 | $2,700 | $1.04 | 0d | 1 | 1.09mi |
HOA detail
- Monthly dues
- $24 · $288/yr
Listing history 28 events
-
2026-05-14status Back On Market
-
2026-05-13historical
-
2026-05-13$259,900 New 1173-char remark
-
2026-04-13historical
-
2026-04-08status Under Contract
-
2026-01-21$259,900 Active
-
2026-01-21historical
-
2026-01-19$259,900 New
-
2026-01-06historical
-
2025-10-31$284,900 New
-
2025-10-13historical
-
2025-06-21$299,900 New
-
2025-06-20historical
-
2025-06-04price $299,900
-
2025-03-24$319,900 New
-
2015-04-14price $59,900
-
2014-02-21historical
-
2014-02-18soldstatus $69,500 Sold
-
2014-02-03price $69,500
-
2014-01-07price $59,900 Reduced
-
2013-12-23price $67,500 Reduced
-
2013-11-22price $72,500 Reduced
-
2013-10-25price $79,900 Reduced
-
2013-10-10price $84,900 Reduced
-
2013-09-05$94,900 New
-
2013-09-04soldstatus $89,372
-
2005-05-26soldstatus $137,000
-
1986-08-21soldstatus $79,000
ⓘ Source: listings_history table (triggers on properties + properties_extension) + one-shot
backfill from property_details.listing_events for pre-trigger history.
Tax reassessment forecast GA · Resets to sale price
- Current annual tax
- $1,995 · $166/mo
- Projected year-2 tax
- $2,391 · $199/mo
- Expected delta
- +$396/yr (+$33/mo · 19.9%)
ⓘ Screening estimate from a state-policy table — verify with the county assessor before closing.
Climate risk First Street
- Flood 1/10 Low FEMA zone X (unshaded) · 0% chance over 30 yrs
- Wildfire 3/10 Moderate
- Heat 5/10 Major 7 d/yr ≥105°F today · 18 d/yr by 30 yrs out
- Wind 6/10 Major 27% chance of damaging wind over 30 yrs
- Air quality 5/10 Major 7 unhealthy d/yr today · 10 by 30 yrs out
Nearby sold comps map
Loading sold comps map…
Walkable amenities ~0.75 mi
Loading nearby amenities…
Taxation est. · year 1
- Rental income
- $37,504
- − Mortgage interest
- −$14,558
- − Property taxes
- −$1,995
- − Insurance
- −$1,300
- − Repairs & maintenance
- −$3,000
- − Management
- −$3,000
- − HOA
- −$288
- − Depreciation
- −$7,561
- Taxable income
- $5,802
- Est. tax owed @ 24.0%
- −$1,392
- After-tax cash flow
- $8,298/yr
For passive investors: Depreciation is non-cash, so a rental often shows a tax loss while cash-flowing — sheltering income. Rental losses are passive: they offset passive income freely, and up to $25,000/yr can offset ordinary (W-2) income if you actively participate and your MAGI is under $100k (phasing out to $0 by $150k); unused losses carry forward. On sale, claimed depreciation is recaptured at up to 25%, and gains may owe capital-gains tax (a 1031 exchange can defer both). Figures are a year-1 estimate at your 24.0% rate — not tax advice; consult a CPA.
Schools (NCES district)
- District
- Rockdale County
- NCES district ID
- 1304410
- Math proficiency
- 14% ▼ -17.00%
- Reading proficiency
- 29% ▼ -11.00%
- Median HH income
- $53,325
- Composite
- 19.42/100
- National rank
- #8776
- State rank
- #136 of 174 in GA
Livability — Lakeview Estates
- Score
- 57/100
- State rank
- #475
- US rank
- #22298
Category grades
Schools grade is shown separately in the Schools card above.
Census & demographics
- County
- Rockdale County · 96,534 people
- Metro
- Atlanta-Sandy Springs-Alpharetta, GA
- Population (ZIP)
- 34,506
- Household income
- $66,153
- Rent vs Own
- Severe rent burden
- 986.0
Population outlook (Rockdale County) Hauer SSP2
- Today (2025)
- 99,145 people
- By 2030
- 104,558 · +5.5%
- By 2040
- 116,100 · +17.1%
- By 2050
- 127,827 · +28.9%
- By 2075
- 159,113 · +60.5%
- By 2100
- 181,178 · +82.7%
Race, ethnicity, and origin ACS 2023
- Neighborhood character
- Diverse neighborhood (Simpson 0.65)
- Race & ethnicity
- Black 49% White 27% Hispanic / Latino 18% Two or more races 8% Asian 1%
- Hispanic origin (detail)
- Mexican 15%
- Common ancestry
- Hispanic 1% Lithuanian 1% Italian 1%
- Foreign-born
- 14% · Canada, South Korea
- Languages at home
- 81% English-only · Spanish 16% French/Haitian/Cajun 2% Korean 1%
Political lean MEDSL · Rockdale
- 2024 margin
- Solid D (+47.5) · D 73.4% · R 25.9%
- 2008→2024 swing
- +37.9pp toward D · 2008: 9.6pp · 2024: 47.5pp
- All cycles
- 2024: D+47.5 2020: D+40.8 2016: D+25.9 2012: D+16.4 2008: D+9.6
Not yet ingested
- Civics
- —
Market trends
- HPI YoY
- ▼ -123.61%
- Current HPI
- 226.9588
- Rent YoY
- ▲ 0.39%
- Metro
- Atlanta-Sandy Springs-Alpharetta, GA
- State GDP YoY
- ▲ 2.66%
- F500 in state
- 28
Industry mix (Fortune 500 HQ in GA)
| Industry | F500 HQs | Revenue |
|---|---|---|
| Paper / Packaging | 2 | $29B |
|
||
| Retail | 1 | $160B |
|
||
| Transportation / Logistics | 1 | $91B |
|
||
| Airlines | 1 | $62B |
|
||
| Consumer Goods | 1 | $47B |
|
||
| Utilities | 1 | $25B |
|
||
Price history
+229.0% since first listed29 events — show timeline
- 2026-05-25 Pending — GAMLS
- 2026-05-14 Relisted — GAMLS
- 2026-05-13 Listing Removed — GAMLS
- 2026-05-13 Listed $259,900 GAMLS
- 2026-04-13 Listing Removed — FMLS
- 2026-04-08 Pending — GAMLS
- 2026-01-21 Listed $259,900 FMLS
- 2026-01-21 Coming Soon — FMLS
- 2026-01-19 Listed $259,900 GAMLS
- 2026-01-06 Listing Removed — GAMLS
- 2025-10-31 Listed $284,900 GAMLS
- 2025-10-13 Listing Removed — GAMLS
- 2025-06-21 Listed $299,900 GAMLS
- 2025-06-20 Listing Removed — GAMLS
- 2025-06-04 Price Changed $299,900 GAMLS
- 2025-03-24 Listed $319,900 GAMLS
- 2015-04-14 Price Changed $59,900 GAMLS
- 2014-02-21 Listing Removed — GAMLS
- 2014-02-18 Sold (MLS) $69,500 GAMLS
- 2014-02-03 Price Changed $69,500 GAMLS
- 2014-01-07 Price Changed $59,900 GAMLS
- 2013-12-23 Price Changed $67,500 GAMLS
- 2013-11-22 Price Changed $72,500 GAMLS
- 2013-10-25 Price Changed $79,900 GAMLS
- 2013-10-10 Price Changed $84,900 GAMLS
- 2013-09-05 Listed $94,900 GAMLS
- 2013-09-04 Sold (Public Records) $89,372 Public Records
- 2005-05-26 Sold (Public Records) $137,000 Public Records
- 1986-08-21 Sold (Public Records) $79,000 Public Records
Property tax history
+10.6%/yrLatest (2025): $1,995 · -4.5% YoY. Source: county tax records.
Cash-flow waterfall
monthlySold comps — $/sqft
last 12 mo · ≤1 miLoading sold comps…