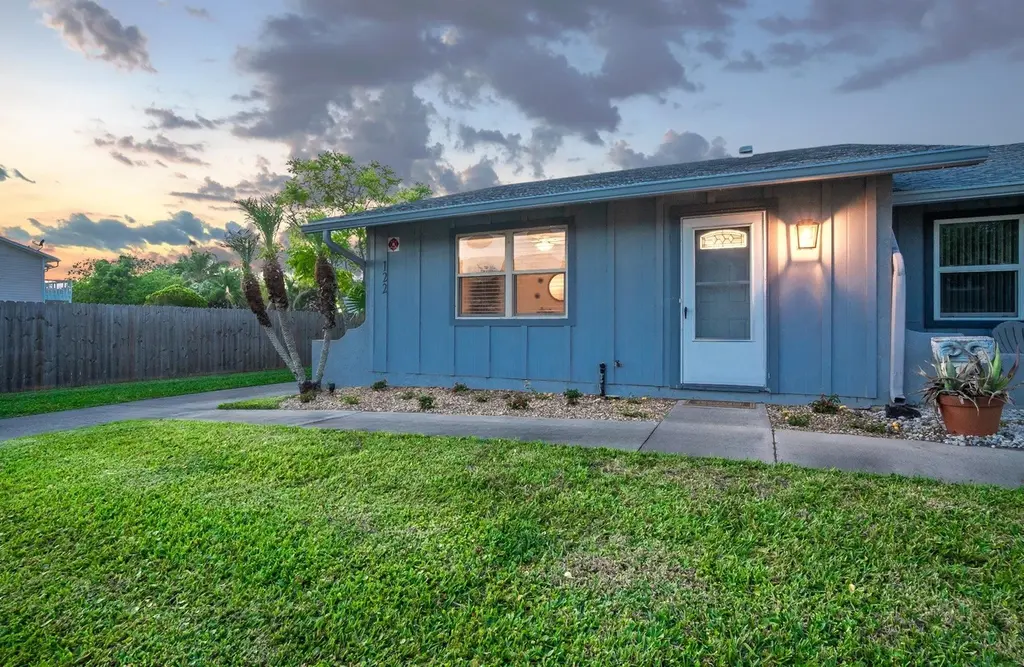
122 Rio Del Mar St Unit A
Butler Beach, FL 32080
$229,000C-
2 bd · 1.5 ba ·
880 sqft ·
Built 1983
· Condo
· Active
· 51 DOM
Cashflow @ list (25.0% down · 7.5%)
Estimated rent
$2,276/mo
Mortgage (P&I)
−$1,201
Tax + insurance
−$746
HOA
−$300
Vac / Maint / Mgmt
−$478
Net cashflow
$-449/mo
Annual
$-5,385/yr
Cap rate
6.18%
Cash-on-cash
-0.42%
DSCR
0.98
1% rule
0.99%
Cash to close
$64,120
Investor read
- This is a 2-bed/1.5-bath condo listed at $229k.
- At list price, monthly cash flow is $-449 ($-5k/yr) — negative.
- To cash-flow at today's rent, offer at most $150k (34.6% below list).
- To meet the 1% rule (rent ≥ 1% of price), the offer needs to be $228k (0.6% below list).
- It's been on market 51 days — a 3% lower offer ($222k) is reasonable based on typical stale-listing flexibility.
- Recommended offer: $150k (34.6% below list) — sets the bar for cash-flow.
- Local home prices are declining (-3.0%/yr); year-one equity from $2k of loan paydown is wiped out by about $7k of value loss. Plan a longer hold.
- Location reads 61/100 on livability (#784 in FL) — a middle-class / working-renter tenant base. Strengths: crime A+, housing A+, employment A-; Watch: health & safety C-, schools D, amenities F.
- St. Johns (rural): math 75% / reading 73% proficiency, ranked #2 of 73 in FL (top 3%) — strong family-tenant draw, lease renewals of 3-5y typical; only 20% free/reduced lunch — higher-income household profile.
- Watch-outs: flood insurance adds $427/mo.
- Market conditions: Rents soft (-1.0%/yr); 535 active listings in the ZIP; 22 comparable units currently listed for rent nearby; rentals at typical pace (median 16d on market — plan ~3-4 weeks tenant-placement turnaround); solid renter incomes; 5,575 units permitted in St. Johns County in 2024 (584 in 5+ unit buildings).
- St. Johns County population projected at +60% by 2050 — long-run rental-demand tailwind backs the buy-and-hold thesis.
- 3 sale attempts since 11y ago with the ask held roughly flat each time — persistent listings suggest the price (not the market) is what's stuck; bring a comps-based counter.
- Current owner paid $125k; list at $229k implies a 83% gain — meaningful room to come down on a strong offer.
- Climate carrying-cost: in FEMA flood zone AE (mandatory federal flood insurance); severe wind risk, 99% chance of damaging wind over 30y; moderate wildfire risk; extreme-heat days projected 7→20/yr by 2055 (HVAC capex compounding) — expect insurance premiums to compound above CPI over the hold.
- Cap rate 6.2% vs local median 2.2% in Butler Beach — top-decile yield for the area; either an underpriced asset or a hidden risk that comps aren't pricing in. Stress-test before assuming the spread holds.
Questions for listing agent
- What do current leases actually rent for vs. the listed asking? Can we see a recent rent roll and the last 12 months of T-12 income?
- It's been on market 51 days. Have you received any prior offers? Is the seller open to a 35% concession, seller financing, or rate buy-down credit?
- What's the actual annual flood-insurance premium (NFIP or private), and is the property in a SFHA with mandatory coverage?
- What does the HOA fee cover, when was the last increase, and are there any pending special assessments or reserve-fund shortfalls?
- Any open or pending special assessments — roof, HVAC, plumbing, elevator, façade? What's the per-unit balance and payoff schedule, and is the seller paying it off at close or rolling it to the buyer?
- Is there a deadline driving the sale (1031 exchange, divorce, estate, relocation)? That informs how much negotiation room exists.
- Schools are D-rated, which usually means shorter tenancies and higher turnover. Who's the typical renter profile here, and what's been the actual vacancy rate?
- What's the average days-on-market for RENTAL listings here right now (not sales)? A rising rental-DOM trend means longer vacancies and softer asking-rent achievability than the comps imply.
CashFlowRE · CFR-YB6E8K815183KP
· Data 11 h ago
cashflowre.app · 2026-05-29