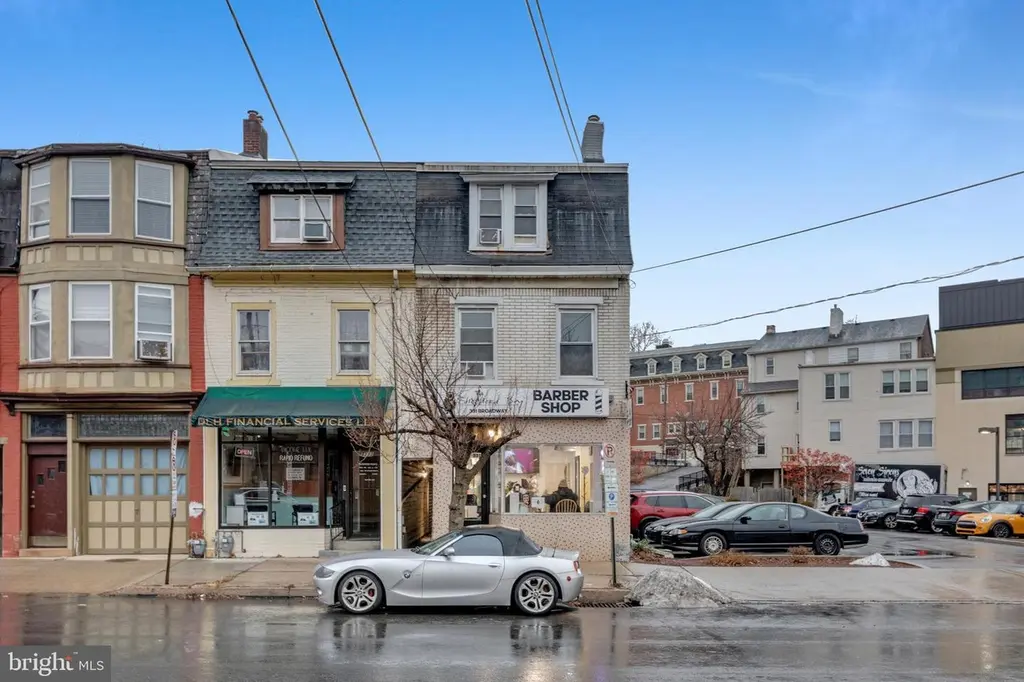
331 Broadway
Bethlehem, PA 18015
$299,000D
1 bd · 1.0 ba ·
2,087 sqft ·
Built 1840
· Other
· Pending
· 14 DOM
Cashflow @ list (25.0% down · 7.5%)
Estimated rent
$2,070/mo
Mortgage (P&I)
−$1,568
Tax + insurance
−$281
HOA
−$0
Vac / Maint / Mgmt
−$435
Net cashflow
$-214/mo
Annual
$-2,569/yr
Cap rate
5.43%
Cash-on-cash
-3.07%
DSCR
0.86
1% rule
0.69%
Cash to close
$83,720
Investor read
- This is a 1-bed/1.0-bath other listed at $299k.
- At list price, monthly cash flow is $-214 ($-3k/yr) — negative.
- To cash-flow at today's rent, offer at most $261k (12.6% below list).
- To meet the 1% rule (rent ≥ 1% of price), the offer needs to be $207k (30.8% below list).
- Only 14 days on market — expect competitive offers; lowballing is unlikely to land.
- Recommended offer: $207k (30.8% below list) — sets the bar for 1% rule.
- Local home prices are declining (-3.0%/yr); year-one equity from $2k of loan paydown is wiped out by about $9k of value loss. Plan a longer hold.
- Location reads 82/100 on livability (#138 in PA, #1,122 nationally) — a professional / high-income tenant draw. Strengths: amenities A+, cost of living A+, housing A+; Watch: commute F.
- Bethlehem Area SD (urban): math 31% / reading 49% proficiency, ranked #342 of 539 in PA (top 64%) — families likely to look elsewhere, expect single-tenant / working-renter base with shorter leases.
- Zoned schools: Fountain Hill El Sch (math 12% / reading 37%, grade F, #1,180 of 1,518 statewide, top 80%, 513 students, 86% FRL); Broughal Ms (math 7% / reading 31%, grade F, #447 of 512 statewide, top 88%, 500 students, 88% FRL); Liberty Hs (math 36% / reading 10%, grade F, #382 of 437 statewide, top 87%, 2,640 students, 50% FRL) — zoned schools average 74% FRL vs 43% district-wide (32 pts higher); higher-poverty schools than district average — tighter screening recommended.
- Zoned-school proficiency averages 22% at this address vs 40% district-wide (-18 pts) — the specific schools serving this property underperform the Bethlehem Area SD average; the district grade overstates school quality for this exact location.
- Watch-outs: built in 1840 — expect roof / HVAC / electrical / plumbing capex.
- Market conditions: Rents rising fast (+7.2%/yr); 159 active listings in the ZIP; 4 comparable units currently listed for rent nearby; rentals lingering (median 46d on market — plan ~5-8 weeks vacancy on turnover, expect pricing pressure); 50% of comp listings sitting > 30 days — soft ceiling on asking rent; 567 units permitted in Northampton County in 2024 (151 in 5+ unit buildings).
- 5 sale attempts with the ask held roughly flat each time — persistent listings suggest the price (not the market) is what's stuck; bring a comps-based counter.
- Cap rate 5.4% vs local median 4.3% in Bethlehem — meaningfully above typical; check what's discounted (condition, days-on-market, listing class) to confirm the premium yield is real.
- This rent runs 41% of the median local income ($61k/yr) — at the standard rent-burdened threshold; future hikes will face affordability resistance.
Questions for listing agent
- What do current leases actually rent for vs. the listed asking? Can we see a recent rent roll and the last 12 months of T-12 income?
- Built in 1840 — when were the roof, HVAC, electrical panel, plumbing, and water heater last replaced?
- Is there a deadline driving the sale (1031 exchange, divorce, estate, relocation)? That informs how much negotiation room exists.
- Schools are B-rated — typically a magnet for longer-tenancy family renters. What's the average tenant stay here, and is there a school-zone premium baked into asking?
- The area grade is low — what's the realistic commute time and amenity access for the typical tenant pool here? Any planned neighborhood developments (good or bad) we should know about?
- What's the average days-on-market for RENTAL listings here right now (not sales)? A rising rental-DOM trend means longer vacancies and softer asking-rent achievability than the comps imply.
- What's the recent tenant-quality profile in this submarket — average credit score on applications, eviction rate, late-payment / NSF rate, and stable-employment percentage? A property-management company in the area should have these aggregated.
- How much new for-sale + rental construction is in the pipeline within 1–3 miles? Heavy new supply typically softens prices + rents 12–24 months out; constrained supply supports both.
CashFlowRE · CFR-YCZJ2WC5XCWGKX
· Data 10 h ago
cashflowre.app · 2026-05-29