 🏷️ Likely Rental
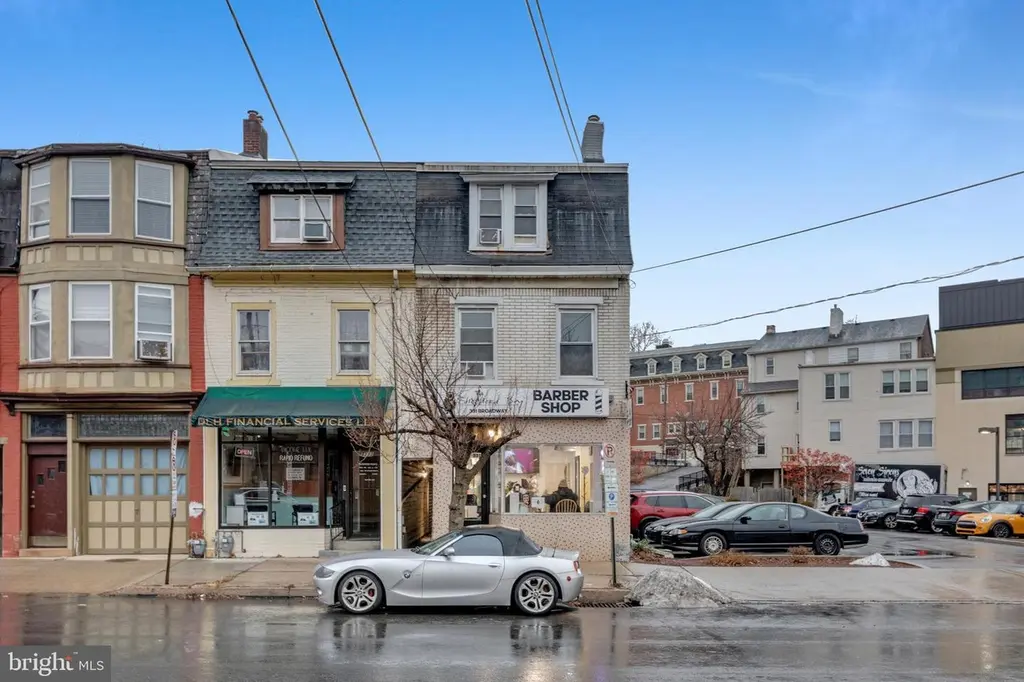
331 Broadway · Bethlehem, PA
Flood risk No data
- FEMA flood zone
- —
- Chance of flooding over 30 yrs
- —
- Est. flood insurance / yr
- —
Fire risk No data
- Est. fire insurance / yr
- —
Heat risk No data
- Hot days now (above threshold)
- —
- Hot days in 30 yrs
- —
Wind risk No data
- Chance of severe wind over 30 yrs
- —
Air-quality risk No data
- Unhealthy air days now
- —
- Unhealthy air days in 30 yrs
- —
Risk factors via First Street. Map © Google.
Why this score? — see what drove the D grade
The composite is a weighted blend of 9 inputs, each scored 0–100. Each bar is that input's sub-score; the figure is the points it added to the 100-point composite (weight × sub-score).
- ARV discount +15.0/15.0
- Cash flow +9.4/30.0
- Rent growth +4.3/5.0
- Livability +4.1/5.0
- Schools +3.5/10.0
- DSCR +2.6/10.0
- Condition / age +2.5/5.0
- 1% rule +1.9/10.0
- Appreciation +0.0/10.0
$299,000
🖨 Deal sheet (PDF) 📄 Offer letter ✓ Due diligence
Listing remarks
2-unit mixed-use property generating $30,612 in gross income and $23347 in net income. The asset features two occupied, income-producing units, including a street-level commercial space occupied by a barbershop and a second/third-floor 2-bedroom, 1-bath residential apartment. Lease expirations in 2026 provide defined near-term rollover. Current income is supported by documented leasing activity within the building and the surrounding South Bethlehem submarket. The commercial tenant pays all of its utilities. Landlord responsibilities are limited to taxes, insurance, water/sewer/trash, and heat for the residential unit only. This asset offers stable in-place income with upside d
Key facts
- 2 parking spots
- Built 1840
- Listed 14 days
Property features AI
Finance
- Other: Assessed value: $22,400; Annual tax: $1,839.83; Zoning: 04CG
- Financial info: Maintenance expense: $500; Operating expense: $7,287; Electric expense: $480; Insurance expense: $1,325; Other expense: $2,162
Exterior
- Parking: On-street parking; 2 total parking spaces
- Utilities: Public water service; Public sewer service; Gas heating
- Home design: Multi-unit property (2 units)
- Construction: Brick construction; Year built: Unknown
- Exterior features: Public water; Public sewer; Brick exterior
Interior
- Bathrooms: 1 full bathroom
- Interior features: Baseboard heating (gas); Wall/window air conditioning units
Neighborhood map
What this means for you Summary
Snapshot
- This is a 1-bed/1.0-bath other listed at $299k.
Deal economics
- At list price, monthly cash flow is $-214 ($-3k/yr) — negative.
- To cash-flow at today's rent, offer at most $261k (12.6% below list).
- To meet the 1% rule (rent ≥ 1% of price), the offer needs to be $207k (30.8% below list).
- Recommended offer: $207k (30.8% below list) — sets the bar for 1% rule.
- Cap rate 5.4% vs local median 4.3% in Bethlehem — meaningfully above typical; check what's discounted (condition, days-on-market, listing class) to confirm the premium yield is real.
Location & tenants
- Location reads 82/100 on livability (#138 in PA, #1,122 nationally) — a professional / high-income tenant draw. Strengths: amenities A+, cost of living A+, housing A+; Watch: commute F.
- Bethlehem Area SD (urban): math 31% / reading 49% proficiency, ranked #342 of 539 in PA (top 64%) — families likely to look elsewhere, expect single-tenant / working-renter base with shorter leases.
- Zoned schools: Fountain Hill El Sch (math 12% / reading 37%, grade F, #1,180 of 1,518 statewide, top 80%, 513 students, 86% FRL); Broughal Ms (math 7% / reading 31%, grade F, #447 of 512 statewide, top 88%, 500 students, 88% FRL); Liberty Hs (math 36% / reading 10%, grade F, #382 of 437 statewide, top 87%, 2,640 students, 50% FRL) — zoned schools average 74% FRL vs 43% district-wide (32 pts higher); higher-poverty schools than district average — tighter screening recommended.
- Zoned-school proficiency averages 22% at this address vs 40% district-wide (-18 pts) — the specific schools serving this property underperform the Bethlehem Area SD average; the district grade overstates school quality for this exact location.
- Market conditions: Rents rising fast (+7.2%/yr); 159 active listings in the ZIP; 4 comparable units currently listed for rent nearby; rentals lingering (median 46d on market — plan ~5-8 weeks vacancy on turnover, expect pricing pressure); 50% of comp listings sitting > 30 days — soft ceiling on asking rent; 567 units permitted in Northampton County in 2024 (151 in 5+ unit buildings).
- This rent runs 41% of the median local income ($61k/yr) — at the standard rent-burdened threshold; future hikes will face affordability resistance.
Forward outlook
- Local home prices are declining (-3.0%/yr); year-one equity from $2k of loan paydown is wiped out by about $9k of value loss. Plan a longer hold.
Negotiation context
- Only 14 days on market — expect competitive offers; lowballing is unlikely to land.
- 5 sale attempts with the ask held roughly flat each time — persistent listings suggest the price (not the market) is what's stuck; bring a comps-based counter.
Risks & watch-outs
- Watch-outs: built in 1840 — expect roof / HVAC / electrical / plumbing capex.
Questions for the listing agent
- What do current leases actually rent for vs. the listed asking? Can we see a recent rent roll and the last 12 months of T-12 income?
- Built in 1840 — when were the roof, HVAC, electrical panel, plumbing, and water heater last replaced?
- Is there a deadline driving the sale (1031 exchange, divorce, estate, relocation)? That informs how much negotiation room exists.
- Schools are B-rated — typically a magnet for longer-tenancy family renters. What's the average tenant stay here, and is there a school-zone premium baked into asking?
- The area grade is low — what's the realistic commute time and amenity access for the typical tenant pool here? Any planned neighborhood developments (good or bad) we should know about?
- What's the average days-on-market for RENTAL listings here right now (not sales)? A rising rental-DOM trend means longer vacancies and softer asking-rent achievability than the comps imply.
- What's the recent tenant-quality profile in this submarket — average credit score on applications, eviction rate, late-payment / NSF rate, and stable-employment percentage? A property-management company in the area should have these aggregated.
- How much new for-sale + rental construction is in the pipeline within 1–3 miles? Heavy new supply typically softens prices + rents 12–24 months out; constrained supply supports both.
Investment metrics
- 1% rule
- 0.69% ✗
- Cap rate
- 5.43%
- Cash-on-cash
- -3.07%
- DSCR
- 0.86
- GRM
- 12.0
CMA / ARV
- ARV (median comp)
- $377,703
- List price
- $299,000
- Delta
- -20.57%
- Verdict
- UNDERPRICED
- Comps
- 13 within 1.0 mi
Projected returns pro-forma
-3.0% appreciation · 7.18% rent growth · sell at horizon
- IRR
- -17.4%
- Equity multiple
- 0.37×
- Total profit
- $-53,119
- Equity at exit
- $44,582
- IRR
- -3.7%
- Equity multiple
- 0.72×
- Total profit
- $-23,654
- Equity at exit
- $25,852
Cash invested: $83,720 (down + closing). Projections, not guarantees.
Landlord ↔ Tenant lean methodology
- Overall (STATE)
- 62 Landlord-Friendly
- State Pennsylvania
- 62 Landlord-Friendly · EVEN
- County
- — inherits STATE
- City
- — inherits STATE
ZIP-level market 18015
- Home prices YoY
- -30.7%
- Rents YoY
- 7.2%
- Active inventory
- 159
- Price-to-rent
- 12.0×
Monthly cashflow live
- Estimated rent
- $2,070 medium interval (Pro) →
- Mortgage (P&I)
- −$1,568
- Tax from tax record
- −$157 /mo · $1,879/yr
- Insurance
- −$125
- HOA
- −$0
- Vacancy / Maint / Mgmt
- −$435
- Net cashflow
- $-214
Break-even live
Sensitivity live
| Price | -10% $-45 | -5% $-129 | +0% $-214 | +5% $-299 | +10% $-383 |
|---|---|---|---|---|---|
| Rent | -10% $-378 | -5% $-296 | +0% $-214 | +5% $-132 | +10% $-51 |
| Rate | -1.0pp $-64 | -0.5pp $-138 | base $-214 | +0.5pp $-292 | +1.0pp $-370 |
UW: 25.0% down · 7.5% · 30yr · 1.5% tax · 5.0% vac · 8.0% maint · 8.0% mgmt
Financing live
Cash to close
- Down payment
- $74,750
- Closing costs
- $8,970
- Reserves months
- —
- Total cash needed
- —
Loan-product check · same deal, 3 products live
Conventional
25% down · 7.5% · 30yr
- Down + closing
- —
- Monthly P&I
- —
- Monthly cashflow
- —
- DSCR
- —
- Eligible?
- —
Personal DTI + credit; lowest rate.
DSCR
20% down · 8.5% · 30yr
- Down + closing
- —
- Monthly P&I
- —
- Monthly cashflow
- —
- DSCR
- —
- Eligible?
- —
No personal income docs; deal must DSCR.
Hard money
10% down · 12.0% · 12mo
- Down + closing
- —
- Monthly P&I
- —
- Monthly cashflow
- —
- DSCR
- —
- Eligible?
- —
Short-term bridge; refi at stabilization.
Rent comps 4 comps
| Address | Beds | Baths | Sqft | Rent | $/sqft | DOM | Units | Dist |
|---|---|---|---|---|---|---|---|---|
| 517 Seneca St Unit 1 Bethlehem, PA | 2.0 | 1.5 | 1500 | $2,200 | $1.47 | 45d | 1 | 0.27mi |
| 11 W 2nd St Bethlehem, PA | 2.0 | 2.0 | 1620 | $2,550 | $1.57 | 25d | 4 | 0.35mi |
| 1024 Delaware Ave Unit 1st Flr Fountain Hill, PA | 1.0 | 1.0 | 2200 | $1,400 | $0.64 | 45d | 1 | 0.69mi |
| 56 W North St Bethlehem, PA | 2.0 | 2.0 | 1486 | $2,400 | $1.62 | 16d | 1 | 0.97mi |
Listing history 18 events
-
2026-06-14statusdays on market $299,000 Pending 14 DOM
-
2026-06-10days on market $299,000 Active 12 DOM
-
2026-06-09days on market $299,000 Active 11 DOM
-
2026-06-09pricedays on market $299,000 Active 10 DOM
-
2026-06-08days on market $300,000 Active 81 DOM
-
2026-06-07days on market $300,000 Active 80 DOM
-
2026-06-03days on market $300,000 Active 76 DOM
-
2026-06-02days on market $300,000 Active 75 DOM
-
2026-06-01days on market $300,000 Active 74 DOM
-
2026-05-31days on market $300,000 Active 73 DOM
-
2026-05-31days on market $300,000 Active 72 DOM
-
2026-04-25status Active 889-char remark
-
2026-04-25status Active 889-char remark
-
2026-03-22status Pending 889-char remark
-
2026-03-10historical Active Under Contract 889-char remark
-
2026-03-02status Pending 889-char remark
-
2026-02-01$300,000 Active 889-char remark
-
2026-01-20$300,000 Active 889-char remark
ⓘ Source: listings_history table (triggers on properties + properties_extension) + one-shot
backfill from property_details.listing_events for pre-trigger history.
Tax reassessment forecast PA · Partial reset (capped growth)
- Current annual tax
- $1,879 · $157/mo
- Projected year-2 tax
- $3,302 · $275/mo
- Expected delta
- +$1,423/yr (+$119/mo · 75.7%)
ⓘ Screening estimate from a state-policy table — verify with the county assessor before closing.
Nearby sold comps map
Loading sold comps map…
Walkable amenities ~0.75 mi
Loading nearby amenities…
Taxation est. · year 1
- Rental income
- $24,836
- − Mortgage interest
- −$16,749
- − Property taxes
- −$1,879
- − Insurance
- −$1,495
- − Repairs & maintenance
- −$1,987
- − Management
- −$1,987
- − Depreciation
- −$8,698
- Taxable loss
- −$7,958
- Est. tax savings @ 24.0%
- +$1,910
- After-tax cash flow
- $-659/yr
For passive investors: Depreciation is non-cash, so a rental often shows a tax loss while cash-flowing — sheltering income. Rental losses are passive: they offset passive income freely, and up to $25,000/yr can offset ordinary (W-2) income if you actively participate and your MAGI is under $100k (phasing out to $0 by $150k); unused losses carry forward. On sale, claimed depreciation is recaptured at up to 25%, and gains may owe capital-gains tax (a 1031 exchange can defer both). Figures are a year-1 estimate at your 24.0% rate — not tax advice; consult a CPA.
Schools (NCES district)
- District
- Bethlehem Area SD
- NCES district ID
- 4203570
- Math proficiency
- 31% ▼ -2.00%
- Reading proficiency
- 49% ▼ -6.00%
- Median HH income
- $55,124
- Composite
- 34.92/100
- National rank
- #5068
- State rank
- #342 of 539 in PA
Livability — Bethlehem
- Score
- 82/100
- State rank
- #138
- US rank
- #1122
Category grades
Schools grade is shown separately in the Schools card above.
Census & demographics
- Census place
- Bethlehem, PA
- County
- Northampton County · 236,814 people
- City population
- 129,661
- Metro
- Allentown-Bethlehem-Easton, PA-NJ
- Population (ZIP)
- 34,852
- Household income
- $60,800
- Rent vs Own
- Severe rent burden
- 1525.0
Population outlook (Northampton County) Hauer SSP2
- Today (2025)
- 312,227 people
- By 2030
- 314,769 · +0.8%
- By 2040
- 316,914 · +1.5%
- By 2050
- 318,037 · +1.9%
- By 2075
- 334,003 · +7.0%
- By 2100
- 344,696 · +10.4%
Race, ethnicity, and origin ACS 2023
- Neighborhood character
- Diverse neighborhood (Simpson 0.62)
- Race & ethnicity
- White 53% Hispanic / Latino 29% Two or more races 14% Black 10% Asian 5%
- Hispanic origin (detail)
- Mexican 2% Puerto Rican 19% Dominican 3%
- Common ancestry
- Romanian 4% Danish 1% Iranian 1%
- Foreign-born
- 12% · Canada, China, Jamaica
- Languages at home
- 73% English-only · Spanish 21% Chinese 2% Other Indo-European 2%
Political lean MEDSL · Northampton
- 2024 margin
- Toss-up / Even · D 48.6% · R 50.4%
- 2008→2024 swing
- -14.1pp toward R · 2008: 12.3pp · 2024: -1.8pp
- All cycles
- 2024: R+1.8 2020: D+0.7 2016: R+3.8 2012: D+4.6 2008: D+12.3
Not yet ingested
- Civics
- —
Market trends
- HPI YoY
- ▼ -122.95%
- Current HPI
- 277.4721
- Rent YoY
- ▲ 7.18%
- Metro
- Allentown-Bethlehem-Easton, PA-NJ
- State GDP YoY
- ▲ 1.68%
- F500 in state
- 34
Industry mix (Fortune 500 HQ in PA)
| Industry | F500 HQs | Revenue |
|---|---|---|
| Healthcare | 2 | $309B |
|
||
| Insurance | 2 | $27B |
|
||
| Telecommunications / Media | 1 | $124B |
|
||
| Industrial Distribution | 1 | $22B |
|
||
| Financial Services | 1 | $20B |
|
||
| Chemicals / Materials | 1 | $18B |
|
||
Price history
-0.3% since first listed12 events — show timeline
- 2026-06-12 Pending — GLVRMLS
- 2026-06-08 Listing Removed — BRIGHT MLS
- 2026-05-31 Price Changed $299,000 GLVRMLS
- 2026-05-30 Listing Removed — GLVRMLS
- 2026-05-29 Listed $300,000 GLVRMLS
- 2026-04-25 Relisted — GLVRMLS
- 2026-04-25 Relisted — BRIGHT MLS
- 2026-03-22 Pending — BRIGHT MLS
- 2026-03-10 Contingent — BRIGHT MLS
- 2026-03-02 Pending — GLVRMLS
- 2026-02-01 Listed $300,000 BRIGHT MLS
- 2026-01-20 Listed $300,000 GLVRMLS
Property tax history
+3.0%/yrLatest (2018): $1,879 · +1.2% YoY. Source: county tax records.
Cash-flow waterfall
monthlySold comps — $/sqft
last 12 mo · ≤1 miLoading sold comps…