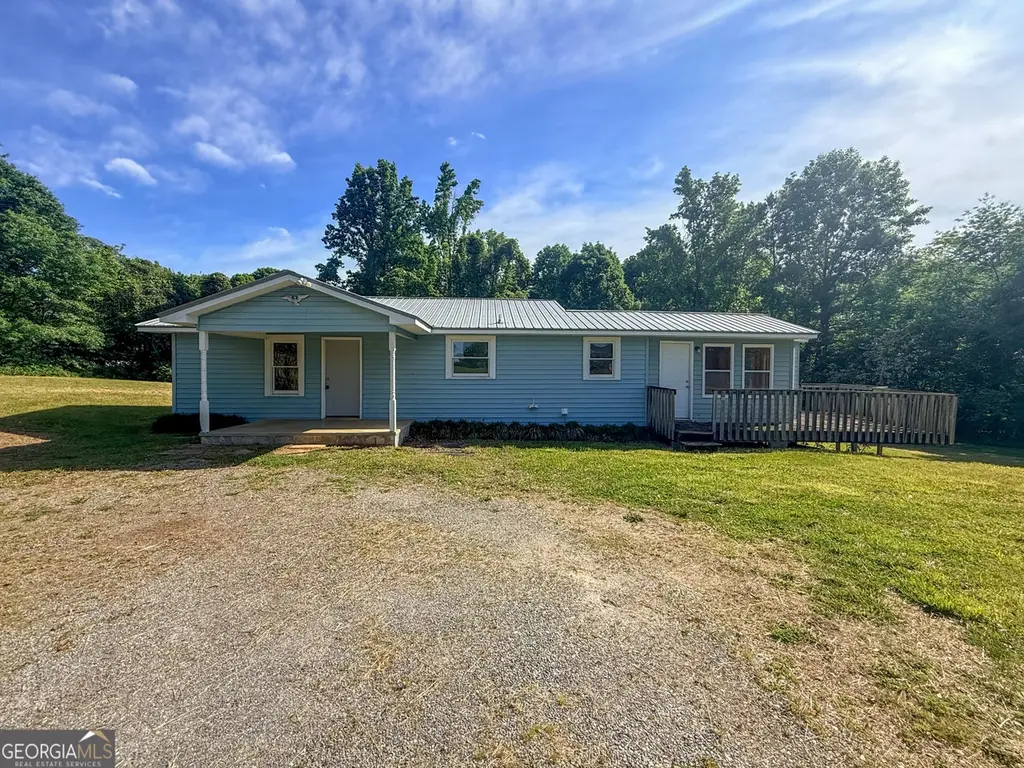
61 Will Hambrick Rd
Cleveland, GA 30528
$199,900D
2 bd · 1.0 ba ·
1,042 sqft ·
Built 1960
· SingleFamily
· Active
· 30 DOM
Cashflow @ list (25.0% down · 7.5%)
Estimated rent
$1,395/mo
Mortgage (P&I)
−$1,048
Tax + insurance
−$151
HOA
−$0
Vac / Maint / Mgmt
−$293
Net cashflow
$-97/mo
Annual
$-1,160/yr
Cap rate
5.71%
Cash-on-cash
-2.07%
DSCR
0.91
1% rule
0.70%
Cash to close
$55,972
Investor read
- This is a 2-bed/1.0-bath single-family listed at $200k.
- At list price, monthly cash flow is $-97 ($-1k/yr) — negative.
- To cash-flow at today's rent, offer at most $183k (8.5% below list).
- To meet the 1% rule (rent ≥ 1% of price), the offer needs to be $140k (30.2% below list).
- It's been on market 30 days — a 2% lower offer ($197k) is reasonable based on typical stale-listing flexibility.
- Recommended offer: $140k (30.2% below list) — sets the bar for 1% rule.
- Local home prices are declining (-3.0%/yr); year-one equity from $1k of loan paydown is wiped out by about $6k of value loss. Plan a longer hold.
- Location reads 79/100 on livability (#17 in GA, #2,292 nationally) — a middle-class / working-renter tenant base. Strengths: crime A+, cost of living A+, housing A+; Watch: amenities F, commute F.
- White County (rural): math 43% / reading 42% proficiency, ranked #35 of 174 in GA (top 20%) — families likely to look elsewhere, expect single-tenant / working-renter base with shorter leases.
- Zoned schools: Mount Yonah Elementary School (math 48% / reading 46%, grade D-, #301 of 1,228 statewide, top 25%, 459 students, 51% FRL); White County Middle School (math 41% / reading 45%, grade D-, #116 of 470 statewide, top 26%, 858 students, 52% FRL); White County High School (math 33% / reading 30%, grade F, #122 of 424 statewide, top 30%, 1,176 students, 43% FRL) — zoned schools at 49% FRL track the district average.
- Market conditions: 444 active listings in the ZIP; 180 units permitted in White County in 2024 (0 in 5+ unit buildings).
- White County population projected at +13% by 2050 — modest demand growth; plan on rents tracking national, not racing it.
- 2 sale attempts; this cycle's ask has dropped $18k (8%) from the opening price — seller is motivated, your offer sets the floor, not the list.
- Cap rate 5.7% vs local median 2.2% in Cleveland — top-decile yield for the area; either an underpriced asset or a hidden risk that comps aren't pricing in. Stress-test before assuming the spread holds.
Questions for listing agent
- What do current leases actually rent for vs. the listed asking? Can we see a recent rent roll and the last 12 months of T-12 income?
- Built in 1960 — when were the roof, HVAC, electrical panel, plumbing, and water heater last replaced?
- Is there a deadline driving the sale (1031 exchange, divorce, estate, relocation)? That informs how much negotiation room exists.
- The area grade is low — what's the realistic commute time and amenity access for the typical tenant pool here? Any planned neighborhood developments (good or bad) we should know about?
- What's the average days-on-market for RENTAL listings here right now (not sales)? A rising rental-DOM trend means longer vacancies and softer asking-rent achievability than the comps imply.
- What's the recent tenant-quality profile in this submarket — average credit score on applications, eviction rate, late-payment / NSF rate, and stable-employment percentage? A property-management company in the area should have these aggregated.
- How much new for-sale + rental construction is in the pipeline within 1–3 miles? Heavy new supply typically softens prices + rents 12–24 months out; constrained supply supports both.
CashFlowRE · CFR-YDB7VB4BZ1271H
· Data 19 h ago
cashflowre.app · 2026-05-29