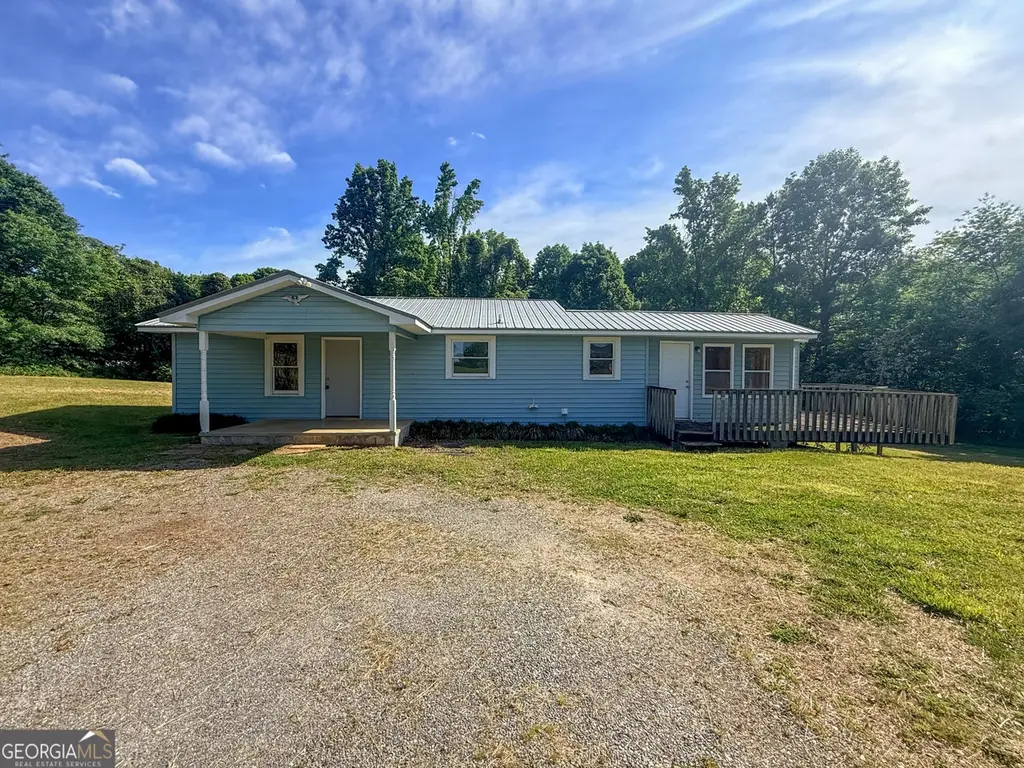
61 Will Hambrick Rd · Cleveland, GA
Flood risk 1/10 · Minimal
- FEMA flood zone
- X (unshaded)
- Chance of flooding over 30 yrs
- 0.0%
- Est. flood insurance / yr
- $507 – $1,088
Fire risk 3/10 · Minor
- Est. fire insurance / yr
- $963 – $1,789
Heat risk 4/10 · Minor
- Hot days now (above 100°F)
- 7 days/yr
- Hot days in 30 yrs
- 18 days/yr
Wind risk 2/10 · Minimal
- Chance of severe wind over 30 yrs
- 4.0%
Air-quality risk 4/10 · Minor
- Unhealthy air days now
- 3 days/yr
- Unhealthy air days in 30 yrs
- 6 days/yr
Risk factors via First Street. Map © Google.
Why this score? — see what drove the D grade
The composite is a weighted blend of 9 inputs, each scored 0–100. Each bar is that input's sub-score; the figure is the points it added to the 100-point composite (weight × sub-score).
- ARV discount +15.0/15.0
- Cash flow +10.7/30.0
- Livability +4.0/5.0
- Schools +3.6/10.0
- DSCR +3.1/10.0
- Rent growth +2.5/5.0
- Condition / age +2.5/5.0
- 1% rule +2.0/10.0
- Appreciation +0.0/10.0
$199,900
🖨 Deal sheet (PDF) 📄 Offer letter ✓ Due diligence
Listing remarks
Charming Home on 1.01 Acres - Ideal for First-Time Buyers! Welcome home to this cozy 2-bedroom, 1-bath property situated on a spacious 1.01-acre lot in a highly desirable location. Perfect for first-time homebuyers, this home offers comfort, convenience, and plenty of outdoor space to enjoy. The large backyard is ideal for kids, pets, entertaining, gardening, or simply relaxing in your own private outdoor retreat. With room to grow and endless possibilities, this property combines peaceful living with easy access to nearby amenities, schools, shopping, and dining. Whether you're looking for your first home, downsizing, or investing, this property is full of potential and ready for you to ma
Key facts
- Large backyard
- 1.01 acres
- 1.01 acre lot
Tags
Property features AI
Finance
- Other: Lot size about 1.01 acres
- HOA & community: No homeowners association
Exterior
- Parking: Kitchen level parking
- Utilities: Well water; Septic tank; Electricity available; Water available
- Home design: Single-family residence; Residential house; Resale property; Built in 1960
- Construction: Vinyl siding; Metal roof; One story
- Exterior features: Deck; Level lot
Interior
- Kitchen: Refrigerator included
- Bedrooms: 2 bedrooms on the main level
- Flooring: Carpet; Laminate
- Bathrooms: 1 full bathroom on the main level
- Heating & cooling: Heat pump heating; Central air conditioning; Ceiling fan(s)
- Interior features: One-level layout; Public-record living area of 1,042 square feet; Sun room
- Laundry & utility: Laundry area (other/unspecified configuration)
Neighborhood map
What this means for you Summary
Snapshot
- This is a 2-bed/1.0-bath single-family listed at $200k.
Deal economics
- At list price, monthly cash flow is $-97 ($-1k/yr) — negative.
- To cash-flow at today's rent, offer at most $183k (8.5% below list).
- To meet the 1% rule (rent ≥ 1% of price), the offer needs to be $140k (30.2% below list).
- Recommended offer: $140k (30.2% below list) — sets the bar for 1% rule.
- Cap rate 5.7% vs local median 2.2% in Cleveland — top-decile yield for the area; either an underpriced asset or a hidden risk that comps aren't pricing in. Stress-test before assuming the spread holds.
Location & tenants
- Location reads 79/100 on livability (#17 in GA, #2,292 nationally) — a middle-class / working-renter tenant base. Strengths: crime A+, cost of living A+, housing A+; Watch: amenities F, commute F.
- White County (rural): math 43% / reading 42% proficiency, ranked #35 of 174 in GA (top 20%) — families likely to look elsewhere, expect single-tenant / working-renter base with shorter leases.
- Zoned schools: Mount Yonah Elementary School (math 48% / reading 46%, grade D-, #301 of 1,228 statewide, top 25%, 459 students, 51% FRL); White County Middle School (math 41% / reading 45%, grade D-, #116 of 470 statewide, top 26%, 858 students, 52% FRL); White County High School (math 33% / reading 30%, grade F, #122 of 424 statewide, top 30%, 1,176 students, 43% FRL) — zoned schools at 49% FRL track the district average.
- Market conditions: 444 active listings in the ZIP; 180 units permitted in White County in 2024 (0 in 5+ unit buildings).
Forward outlook
- Local home prices are declining (-3.0%/yr); year-one equity from $1k of loan paydown is wiped out by about $6k of value loss. Plan a longer hold.
- White County population projected at +13% by 2050 — modest demand growth; plan on rents tracking national, not racing it.
Negotiation context
- It's been on market 30 days — a 2% lower offer ($197k) is reasonable based on typical stale-listing flexibility.
- 2 sale attempts; this cycle's ask has dropped $18k (8%) from the opening price — seller is motivated, your offer sets the floor, not the list.
Questions for the listing agent
- What do current leases actually rent for vs. the listed asking? Can we see a recent rent roll and the last 12 months of T-12 income?
- Built in 1960 — when were the roof, HVAC, electrical panel, plumbing, and water heater last replaced?
- Is there a deadline driving the sale (1031 exchange, divorce, estate, relocation)? That informs how much negotiation room exists.
- The area grade is low — what's the realistic commute time and amenity access for the typical tenant pool here? Any planned neighborhood developments (good or bad) we should know about?
- What's the average days-on-market for RENTAL listings here right now (not sales)? A rising rental-DOM trend means longer vacancies and softer asking-rent achievability than the comps imply.
- What's the recent tenant-quality profile in this submarket — average credit score on applications, eviction rate, late-payment / NSF rate, and stable-employment percentage? A property-management company in the area should have these aggregated.
- How much new for-sale + rental construction is in the pipeline within 1–3 miles? Heavy new supply typically softens prices + rents 12–24 months out; constrained supply supports both.
Investment metrics
- 1% rule
- 0.70% ✗
- Cap rate
- 5.71%
- Cash-on-cash
- -2.07%
- DSCR
- 0.91
- GRM
- 11.9
CMA / ARV
- ARV (median comp)
- $262,466
- List price
- $199,900
- Delta
- -16.98%
- Verdict
- UNDERPRICED
- Comps
- 3 within 1.0 mi
Projected returns pro-forma
-3.0% appreciation · 3.0% rent growth · sell at horizon
- IRR
- -19.8%
- Equity multiple
- 0.31×
- Total profit
- $-38,642
- Equity at exit
- $29,806
- IRR
- -12.8%
- Equity multiple
- 0.25×
- Total profit
- $-41,948
- Equity at exit
- $17,284
Cash invested: $55,972 (down + closing). Projections, not guarantees.
Landlord ↔ Tenant lean methodology
- Overall (STATE)
- 90 Strongly Landlord-Friendly
- State Georgia
- 90 Strongly Landlord-Friendly · R+3
- County
- — inherits STATE
- City
- — inherits STATE
ZIP-level market 30528
- Home prices YoY
- -10.6%
- Active inventory
- 444
- Price-to-rent
- 11.9×
Monthly cashflow live
- Estimated rent
- $1,395 medium interval (Pro) →
- Mortgage (P&I)
- −$1,048
- Tax from tax record
- −$67 /mo · $807/yr
- Insurance
- −$83
- HOA
- −$0
- Vacancy / Maint / Mgmt
- −$293
- Net cashflow
- $-97
Break-even live
Sensitivity live
| Price | -10% $16 | -5% $-40 | +0% $-97 | +5% $-153 | +10% $-210 |
|---|---|---|---|---|---|
| Rent | -10% $-207 | -5% $-152 | +0% $-97 | +5% $-42 | +10% $14 |
| Rate | -1.0pp $4 | -0.5pp $-46 | base $-97 | +0.5pp $-148 | +1.0pp $-201 |
UW: 25.0% down · 7.5% · 30yr · 1.5% tax · 5.0% vac · 8.0% maint · 8.0% mgmt
Financing live
Cash to close
- Down payment
- $49,975
- Closing costs
- $5,997
- Reserves months
- —
- Total cash needed
- —
Loan-product check · same deal, 3 products live
Conventional
25% down · 7.5% · 30yr
- Down + closing
- —
- Monthly P&I
- —
- Monthly cashflow
- —
- DSCR
- —
- Eligible?
- —
Personal DTI + credit; lowest rate.
DSCR
20% down · 8.5% · 30yr
- Down + closing
- —
- Monthly P&I
- —
- Monthly cashflow
- —
- DSCR
- —
- Eligible?
- —
No personal income docs; deal must DSCR.
Hard money
10% down · 12.0% · 12mo
- Down + closing
- —
- Monthly P&I
- —
- Monthly cashflow
- —
- DSCR
- —
- Eligible?
- —
Short-term bridge; refi at stabilization.
Listing history 16 events
-
2026-06-22days on market $199,900 Active 30 DOM
-
2026-06-18days on market $199,900 Active 27 DOM
-
2026-06-17days on market $199,900 Active 26 DOM
-
2026-06-16days on market $199,900 Active 25 DOM
-
2026-06-15days on market $199,900 Active 24 DOM
-
2026-06-14statusdays on market $199,900 Active 22 DOM
-
2026-06-10pricestatusdays on market $199,900 Price Change 19 DOM
-
2026-06-09days on market $217,900 Active 18 DOM
-
2026-06-08days on market $217,900 Active 17 DOM
-
2026-06-07statusdays on market $217,900 Active 16 DOM
-
2026-06-03days on market $217,900 New 12 DOM
-
2026-06-02days on market $217,900 New 11 DOM
-
2026-06-01days on market $217,900 New 10 DOM
-
2026-05-31days on market $217,900 New 9 DOM
-
2026-05-31days on market $217,900 New 8 DOM
-
2026-05-01$217,900 New 714-char remark
ⓘ Source: listings_history table (triggers on properties + properties_extension) + one-shot
backfill from property_details.listing_events for pre-trigger history.
Tax reassessment forecast GA · Resets to sale price
- Current annual tax
- $807 · $67/mo
- Projected year-2 tax
- $1,839 · $153/mo
- Expected delta
- +$1,032/yr (+$86/mo · 127.8%)
ⓘ Screening estimate from a state-policy table — verify with the county assessor before closing.
Climate risk First Street
- Flood 1/10 Low FEMA zone X (unshaded) · 0% chance over 30 yrs
- Wildfire 3/10 Moderate
- Heat 4/10 Moderate 7 d/yr ≥100°F today · 18 d/yr by 30 yrs out
- Wind 2/10 Low 4% chance of damaging wind over 30 yrs
- Air quality 4/10 Moderate 3 unhealthy d/yr today · 6 by 30 yrs out
Nearby sold comps map
Loading sold comps map…
Walkable amenities ~0.75 mi
Loading nearby amenities…
Taxation est. · year 1
- Rental income
- $16,742
- − Mortgage interest
- −$11,198
- − Property taxes
- −$807
- − Insurance
- −$1,000
- − Repairs & maintenance
- −$1,339
- − Management
- −$1,339
- − Depreciation
- −$5,815
- Taxable loss
- −$4,756
- Est. tax savings @ 24.0%
- +$1,142
- After-tax cash flow
- $-19/yr
For passive investors: Depreciation is non-cash, so a rental often shows a tax loss while cash-flowing — sheltering income. Rental losses are passive: they offset passive income freely, and up to $25,000/yr can offset ordinary (W-2) income if you actively participate and your MAGI is under $100k (phasing out to $0 by $150k); unused losses carry forward. On sale, claimed depreciation is recaptured at up to 25%, and gains may owe capital-gains tax (a 1031 exchange can defer both). Figures are a year-1 estimate at your 24.0% rate — not tax advice; consult a CPA.
Schools (NCES district)
- District
- White County
- NCES district ID
- 1305670
- Math proficiency
- 43% ▼ -12.00%
- Reading proficiency
- 42% ▼ -11.00%
- Median HH income
- $41,998
- Composite
- 35.81/100
- National rank
- #4829
- State rank
- #35 of 174 in GA
Livability — Cleveland
- Score
- 79/100
- State rank
- #17
- US rank
- #2292
Category grades
Schools grade is shown separately in the Schools card above.
Census & demographics
- Population (ZIP)
- 23,757
Population outlook (White County) Hauer SSP2
- Today (2025)
- 30,911 people
- By 2030
- 32,024 · +3.6%
- By 2040
- 33,803 · +9.4%
- By 2050
- 35,049 · +13.4%
- By 2075
- 37,962 · +22.8%
- By 2100
- 38,244 · +23.7%
Race, ethnicity, and origin ACS 2023
- Neighborhood character
- Predominantly White (91%)
- Race & ethnicity
- White 91% Two or more races 4% Hispanic / Latino 4% Black 2%
- Common ancestry
- Slovak 4% Romanian 2% Lithuanian 2%
- Foreign-born
- 3% · Canada
- Languages at home
- 96% English-only · Spanish 3%
Political lean MEDSL · White
- 2024 margin
- Solid R (+68.5) · D 15.5% · R 84.0%
- 2008→2024 swing
- -10.0pp toward R · 2008: -58.5pp · 2024: -68.5pp
- All cycles
- 2024: R+68.5 2020: R+66.2 2016: R+68.6 2012: R+66.6 2008: R+58.5
Not yet ingested
- Civics
- —
Market trends
- HPI YoY
- ▼ -31.32%
- Current HPI
- 265.3183
- Rent YoY
- —
- Metro
- —
- State GDP YoY
- ▲ 2.66%
- F500 in state
- 28
Industry mix (Fortune 500 HQ in GA)
| Industry | F500 HQs | Revenue |
|---|---|---|
| Paper / Packaging | 2 | $29B |
|
||
| Retail | 1 | $160B |
|
||
| Transportation / Logistics | 1 | $91B |
|
||
| Airlines | 1 | $62B |
|
||
| Consumer Goods | 1 | $47B |
|
||
| Utilities | 1 | $25B |
|
||
Price history
-8.3% since first listed4 events — show timeline
- 2026-06-09 Price Changed $199,900 GAMLS
- 2026-05-22 Listing Removed — GAMLS
- 2026-05-01 Listed $217,900 GAMLS
- 2026-05-01 Listed $217,900 GAMLS
Property tax history
+4.4%/yrLatest (2025): $807 · +1.8% YoY. Source: county tax records.
Cash-flow waterfall
monthlySold comps — $/sqft
last 12 mo · ≤1 miLoading sold comps…