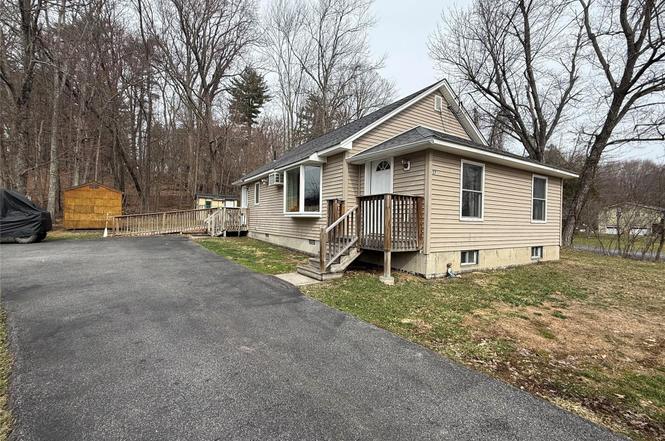
27 Hardenburg Rd
Pine Bush, NY 12566
$275,000D
2 bd · 1.0 ba ·
792 sqft ·
Built 1950
· SingleFamily
· Pending
· 7 DOM
Cashflow @ list (25.0% down · 7.5%)
Estimated rent
$1,988/mo
Mortgage (P&I)
−$1,442
Tax + insurance
−$429
HOA
−$0
Vac / Maint / Mgmt
−$417
Net cashflow
$-301/mo
Annual
$-3,607/yr
Cap rate
4.98%
Cash-on-cash
-4.68%
DSCR
0.79
1% rule
0.72%
Cash to close
$77,000
Investor read
- This is a 2-bed/1.0-bath single-family listed at $275k.
- At list price, monthly cash flow is $-301 ($-4k/yr) — negative.
- To cash-flow at today's rent, offer at most $222k (19.3% below list).
- To meet the 1% rule (rent ≥ 1% of price), the offer needs to be $199k (27.7% below list).
- Only 7 days on market — expect competitive offers; lowballing is unlikely to land.
- Recommended offer: $199k (27.7% below list) — sets the bar for 1% rule.
- In year one you build about $24k of equity ($2k loan paydown + $22k appreciation (8.0% local appreciation)).
- Location reads 69/100 on livability (#480 in NY) — a middle-class / working-renter tenant base. Strengths: crime A+, housing A+, health & safety A; Watch: cost of living C-, amenities F, commute F.
- Pine Bush Central School District (rural): math 38% / reading 45% proficiency, ranked #468 of 590 in NY (top 79%) — families likely to look elsewhere, expect single-tenant / working-renter base with shorter leases.
- Zoned schools: E J Russell Elementary School (math 22% / reading 42%, grade F, #1,646 of 2,108 statewide, top 80%, 523 students, 42% FRL); Crispell Middle School (math 17% / reading 46%, grade F, #522 of 729 statewide, top 73%, 633 students, 52% FRL); Pine Bush Senior High School (math 92% / reading 67%, grade A-, #518 of 1,100 statewide, top 51%, 1,615 students, 56% FRL) — zoned schools average 50% FRL vs 29% district-wide (21 pts higher); higher-poverty schools than district average — tighter screening recommended.
- Watch-outs: built in 1950 — expect roof / HVAC / electrical / plumbing capex.
- Market conditions: 83 active listings in the ZIP; 4 comparable units currently listed for rent nearby; rentals at typical pace (median 15d on market — plan ~3-4 weeks tenant-placement turnaround); 1,746 units permitted in Orange County in 2024 (1,265 in 5+ unit buildings).
- Current owner paid $175k; list at $275k implies a 57% gain — meaningful room to come down on a strong offer.
- By year 2, paydown + projected appreciation supports a ~$38k cash-out refi (75% LTV) — recoverable capital for the next deal without selling this one.
- Cap rate 5.0% vs local median 2.0% in Pine Bush — top-decile yield for the area; either an underpriced asset or a hidden risk that comps aren't pricing in. Stress-test before assuming the spread holds.
Questions for listing agent
- What do current leases actually rent for vs. the listed asking? Can we see a recent rent roll and the last 12 months of T-12 income?
- Built in 1950 — when were the roof, HVAC, electrical panel, plumbing, and water heater last replaced?
- Is there a deadline driving the sale (1031 exchange, divorce, estate, relocation)? That informs how much negotiation room exists.
- The area grade is low — what's the realistic commute time and amenity access for the typical tenant pool here? Any planned neighborhood developments (good or bad) we should know about?
- What's the average days-on-market for RENTAL listings here right now (not sales)? A rising rental-DOM trend means longer vacancies and softer asking-rent achievability than the comps imply.
- What's the recent tenant-quality profile in this submarket — average credit score on applications, eviction rate, late-payment / NSF rate, and stable-employment percentage? A property-management company in the area should have these aggregated.
- How much new for-sale + rental construction is in the pipeline within 1–3 miles? Heavy new supply typically softens prices + rents 12–24 months out; constrained supply supports both.
CashFlowRE · CFR-YDCG694H84WREM
· Data 3 weeks ago
cashflowre.app · 2026-05-29