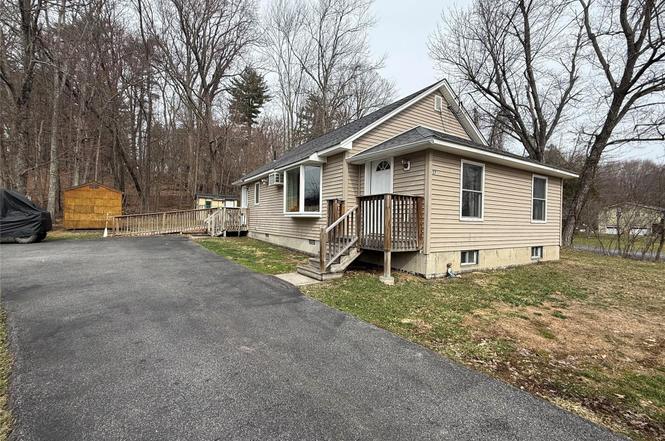
27 Hardenburg Rd · Pine Bush, NY
Flood risk 1/10 · Minimal
- FEMA flood zone
- X (unshaded)
- Chance of flooding over 30 yrs
- 0.0%
- Est. flood insurance / yr
- $507 – $1,088
Fire risk 3/10 · Minor
- Est. fire insurance / yr
- $691 – $1,283
Heat risk 4/10 · Minor
- Hot days now (above 98°F)
- 7 days/yr
- Hot days in 30 yrs
- 15 days/yr
Wind risk 4/10 · Minor
- Chance of severe wind over 30 yrs
- 10.0%
Air-quality risk 2/10 · Minimal
- Unhealthy air days now
- 1 days/yr
- Unhealthy air days in 30 yrs
- 1 days/yr
Risk factors via First Street. Map © Google.
Why this score? — see what drove the D grade
The composite is a weighted blend of 9 inputs, each scored 0–100. Each bar is that input's sub-score; the figure is the points it added to the 100-point composite (weight × sub-score).
- Appreciation +9.0/10.0
- Cash flow +7.8/30.0
- ARV discount +7.5/15.0
- Schools +3.8/10.0
- Livability +3.5/5.0
- Rent growth +2.5/5.0
- Condition / age +2.5/5.0
- 1% rule +2.2/10.0
- DSCR +1.9/10.0
$275,000
🖨 Deal sheet 📄 Offer letter ✓ Due diligence
Listing remarks
Charming ranch-style home set on a beautiful piece of property with a nice yard--perfect for comfortable living! This inviting home features three bedrooms and one full bath, a bright and cheerful living room with a lovely bay window that fills the home with natural light, and a nice kitchen ready for everyday cooking and entertaining. Inside you'll find hardwood floors & carpeting, good closet space and the convenience of a washer/dryer. This is a wonderful opportunity to own a cozy, well-kept home with great curb appeal and just minutes from downtown shops and restaurants. Highest and best by 3/22 @5pm.
Key facts
- 0.31 acre lot
- Built 1950
- Listed 7 days
Neighborhood map
What this means for you Summary
Snapshot
- This is a 2-bed/1.0-bath single-family listed at $275k.
Deal economics
- At list price, monthly cash flow is $-301 ($-4k/yr) — negative.
- To cash-flow at today's rent, offer at most $222k (19.3% below list).
- To meet the 1% rule (rent ≥ 1% of price), the offer needs to be $199k (27.7% below list).
- Recommended offer: $199k (27.7% below list) — sets the bar for 1% rule.
- Cap rate 5.0% vs local median 2.0% in Pine Bush — top-decile yield for the area; either an underpriced asset or a hidden risk that comps aren't pricing in. Stress-test before assuming the spread holds.
Location & tenants
- Location reads 69/100 on livability (#480 in NY) — a middle-class / working-renter tenant base. Strengths: crime A+, housing A+, health & safety A; Watch: cost of living C-, amenities F, commute F.
- Pine Bush Central School District (rural): math 38% / reading 45% proficiency, ranked #468 of 590 in NY (top 79%) — families likely to look elsewhere, expect single-tenant / working-renter base with shorter leases.
- Zoned schools: E J Russell Elementary School (math 22% / reading 42%, grade F, #1,646 of 2,108 statewide, top 80%, 523 students, 42% FRL); Crispell Middle School (math 17% / reading 46%, grade F, #522 of 729 statewide, top 73%, 633 students, 52% FRL); Pine Bush Senior High School (math 92% / reading 67%, grade A-, #518 of 1,100 statewide, top 51%, 1,615 students, 56% FRL) — zoned schools average 50% FRL vs 29% district-wide (21 pts higher); higher-poverty schools than district average — tighter screening recommended.
- Market conditions: 83 active listings in the ZIP; 4 comparable units currently listed for rent nearby; rentals at typical pace (median 14d on market — plan ~3-4 weeks tenant-placement turnaround); 1,746 units permitted in Orange County in 2024 (1,265 in 5+ unit buildings).
Forward outlook
- In year one you build about $24k of equity ($2k loan paydown + $22k appreciation (8.0% local appreciation)).
- By year 2, paydown + projected appreciation supports a ~$38k cash-out refi (75% LTV) — recoverable capital for the next deal without selling this one.
Negotiation context
- Only 7 days on market — expect competitive offers; lowballing is unlikely to land.
- Current owner paid $175k; list at $275k implies a 57% gain — meaningful room to come down on a strong offer.
Risks & watch-outs
- Watch-outs: built in 1950 — expect roof / HVAC / electrical / plumbing capex.
Questions for the listing agent
- What do current leases actually rent for vs. the listed asking? Can we see a recent rent roll and the last 12 months of T-12 income?
- Built in 1950 — when were the roof, HVAC, electrical panel, plumbing, and water heater last replaced?
- Is there a deadline driving the sale (1031 exchange, divorce, estate, relocation)? That informs how much negotiation room exists.
- The area grade is low — what's the realistic commute time and amenity access for the typical tenant pool here? Any planned neighborhood developments (good or bad) we should know about?
- What's the average days-on-market for RENTAL listings here right now (not sales)? A rising rental-DOM trend means longer vacancies and softer asking-rent achievability than the comps imply.
- What's the recent tenant-quality profile in this submarket — average credit score on applications, eviction rate, late-payment / NSF rate, and stable-employment percentage? A property-management company in the area should have these aggregated.
- How much new for-sale + rental construction is in the pipeline within 1–3 miles? Heavy new supply typically softens prices + rents 12–24 months out; constrained supply supports both.
Investment metrics
- 1% rule
- 0.72% ✗
- Cap rate
- 4.98%
- Cash-on-cash
- -4.68%
- DSCR
- 0.79
- GRM
- 11.5
CMA / ARV
No comps found within radius.
Projected returns pro-forma
8.04% appreciation · 3.0% rent growth · sell at horizon
- IRR
- 16.6%
- Equity multiple
- 2.23×
- Total profit
- $94,899
- Equity at exit
- $209,720
- IRR
- 15.9%
- Equity multiple
- 4.76×
- Total profit
- $289,611
- Equity at exit
- $417,052
Cash invested: $77,000 (down + closing). Projections, not guarantees.
Landlord ↔ Tenant lean methodology
- Overall (STATE)
- 15 Strongly Tenant-Friendly
- State New York
- 15 Strongly Tenant-Friendly · D+10
- County
- — inherits STATE
- City
- — inherits STATE
ZIP-level market 12566
- Home prices YoY
- 2.5%
- Active inventory
- 83
- Price-to-rent
- 11.5×
Monthly cashflow live
- Estimated rent
- $1,988 medium interval (Pro) →
- Mortgage (P&I)
- −$1,442
- Tax from tax record
- −$314 /mo · $3,772/yr
- Insurance
- −$115
- HOA
- −$0
- Vacancy / Maint / Mgmt
- −$417
- Net cashflow
- $-301
Break-even live
UW: 25.0% down · 7.5% · 30yr · 1.5% tax · 5.0% vac · 8.0% maint · 8.0% mgmt
Financing live
Cash to close
- Down payment
- $68,750
- Closing costs
- $8,250
- Reserves months
- —
- Total cash needed
- —
Loan-product check · same deal, 3 products live
Conventional
25% down · 7.5% · 30yr
- Down + closing
- —
- Monthly P&I
- —
- Monthly cashflow
- —
- DSCR
- —
- Eligible?
- —
Personal DTI + credit; lowest rate.
DSCR
20% down · 8.5% · 30yr
- Down + closing
- —
- Monthly P&I
- —
- Monthly cashflow
- —
- DSCR
- —
- Eligible?
- —
No personal income docs; deal must DSCR.
Hard money
10% down · 12.0% · 12mo
- Down + closing
- —
- Monthly P&I
- —
- Monthly cashflow
- —
- DSCR
- —
- Eligible?
- —
Short-term bridge; refi at stabilization.
Rent comps 4 comps
| Address | Beds | Baths | Sqft | Rent | $/sqft | DOM | Units | Dist |
|---|---|---|---|---|---|---|---|---|
| 85 Center St Unit A Pine Bush, NY | 2.0 | 1.0 | 900 | $1,800 | $2.00 | 13d | 1 | 0.40mi |
| 12 Edmunds Ln Pine Bush, NY | 2.0 | 2.0 | 1100 | $2,200 | $2.00 | 14d | 1 | 0.57mi |
| 14 Edmunds Ln Pine Bush, NY | 2.0 | 1.5 | 1120 | $2,250 | $2.01 | 14d | 1 | 0.58mi |
| 15 Kelly Ln Unit E Pine Bush, NY | 2.0 | 1.0 | 900 | $1,850 | $2.06 | 14d | 1 | 0.69mi |
Listing history 5 events
-
2026-05-07status Pending
-
2026-03-17$275,000 Active
-
2026-03-13historical $275,000
-
2018-08-08soldstatus $175,000
-
2010-06-16soldstatus $85,000
ⓘ Source: listings_history table (triggers on properties + properties_extension) + one-shot
backfill from property_details.listing_events for pre-trigger history.
Tax reassessment forecast NY · Partial reset (capped growth)
- Current annual tax
- $3,772 · $314/mo
- Projected year-2 tax
- $4,210 · $351/mo
- Expected delta
- +$438/yr (+$36/mo · 11.6%)
ⓘ Screening estimate from a state-policy table — verify with the county assessor before closing.
Climate risk First Street
- Flood 1/10 Low FEMA zone X (unshaded) · 0% chance over 30 yrs
- Wildfire 3/10 Moderate
- Heat 4/10 Moderate 7 d/yr ≥98°F today · 15 d/yr by 30 yrs out
- Wind 4/10 Moderate 10% chance of damaging wind over 30 yrs
- Air quality 2/10 Low 1 unhealthy d/yr today · 1 by 30 yrs out
Nearby sold comps map
Loading sold comps map…
Walkable amenities ~0.75 mi
Loading nearby amenities…
Taxation est. · year 1
- Rental income
- $23,855
- − Mortgage interest
- −$15,404
- − Property taxes
- −$3,772
- − Insurance
- −$1,375
- − Repairs & maintenance
- −$1,908
- − Management
- −$1,908
- − Depreciation
- −$8,000
- Taxable loss
- −$8,513
- Est. tax savings @ 24.0%
- +$2,043
- After-tax cash flow
- $-1,564/yr
For passive investors: Depreciation is non-cash, so a rental often shows a tax loss while cash-flowing — sheltering income. Rental losses are passive: they offset passive income freely, and up to $25,000/yr can offset ordinary (W-2) income if you actively participate and your MAGI is under $100k (phasing out to $0 by $150k); unused losses carry forward. On sale, claimed depreciation is recaptured at up to 25%, and gains may owe capital-gains tax (a 1031 exchange can defer both). Figures are a year-1 estimate at your 24.0% rate — not tax advice; consult a CPA.
Schools (NCES district)
- District
- Pine Bush Central School District
- NCES district ID
- 3623010
- Math proficiency
- 38% ▼ -16.00%
- Reading proficiency
- 45% ▼ -7.00%
- Median HH income
- $72,525
- Composite
- 37.87/100
- National rank
- #4324
- State rank
- #468 of 590 in NY
Livability — Pine Bush
- Score
- 69/100
- State rank
- #480
- US rank
- #8470
Category grades
Schools grade is shown separately in the Schools card above.
Census & demographics
- Census place
- Pine Bush, NY
- Population (ZIP)
- 11,718
Population outlook (Orange County) Hauer SSP2
- Today (2025)
- 379,830 people
- By 2030
- 378,955 · -0.2%
- By 2040
- 375,444 · -1.2%
- By 2050
- 369,311 · -2.8%
- By 2075
- 354,233 · -6.7%
- By 2100
- 318,150 · -16.2%
Race, ethnicity, and origin ACS 2023
- Neighborhood character
- Predominantly White (77%)
- Race & ethnicity
- White 77% Two or more races 12% Hispanic / Latino 10% Black 3% Asian 1%
- Hispanic origin (detail)
- Mexican 4% Puerto Rican 4%
- Common ancestry
- Romanian 3% Serbian 2% Slovak 2%
- Foreign-born
- 7% · Canada, China
- Languages at home
- 93% English-only · Spanish 4% Other Indo-European 1% Chinese 1%
Political lean MEDSL · Orange
- 2024 margin
- Lean R (+8.4) · D 45.8% · R 54.2%
- 2008→2024 swing
- -12.5pp toward R · 2008: 4.1pp · 2024: -8.4pp
- All cycles
- 2024: R+8.4 2020: R+0.2 2016: R+6.5 2012: D+5.2 2008: D+4.1
Not yet ingested
- Civics
- —
Market trends
- HPI YoY
- ▲ 8.04%
- Current HPI
- 329.8706
- Rent YoY
- —
- Metro
- —
- State GDP YoY
- ▲ 2.60%
- F500 in state
- 92
Industry mix (Fortune 500 HQ in NY)
| Industry | F500 HQs | Revenue |
|---|---|---|
| Financial Services | 10 | $950B |
|
||
| Consumer Goods | 9 | $162B |
|
||
| Insurance | 4 | $225B |
|
||
| Telecommunications | 2 | $144B |
|
||
| Pharmaceuticals | 2 | $112B |
|
||
| Media / Entertainment | 2 | $69B |
|
||
Price history
+223.5% since first listed5 events — show timeline
- 2026-05-07 Pending — OneKey® MLS as Distributed by MLS Grid
- 2026-03-17 Listed $275,000 OneKey® MLS as Distributed by MLS Grid
- 2026-03-13 Coming Soon $275,000 OneKey® MLS as Distributed by MLS Grid
- 2018-08-08 Sold (Public Records) $175,000 Public Records
- 2010-06-16 Sold (Public Records) $85,000 Public Records
Property tax history
+1.1%/yrLatest (2025): $3,772 · -0.4% YoY. Source: county tax records.
Cash-flow waterfall
monthlySold comps — $/sqft
last 12 mo · ≤1 miLoading sold comps…