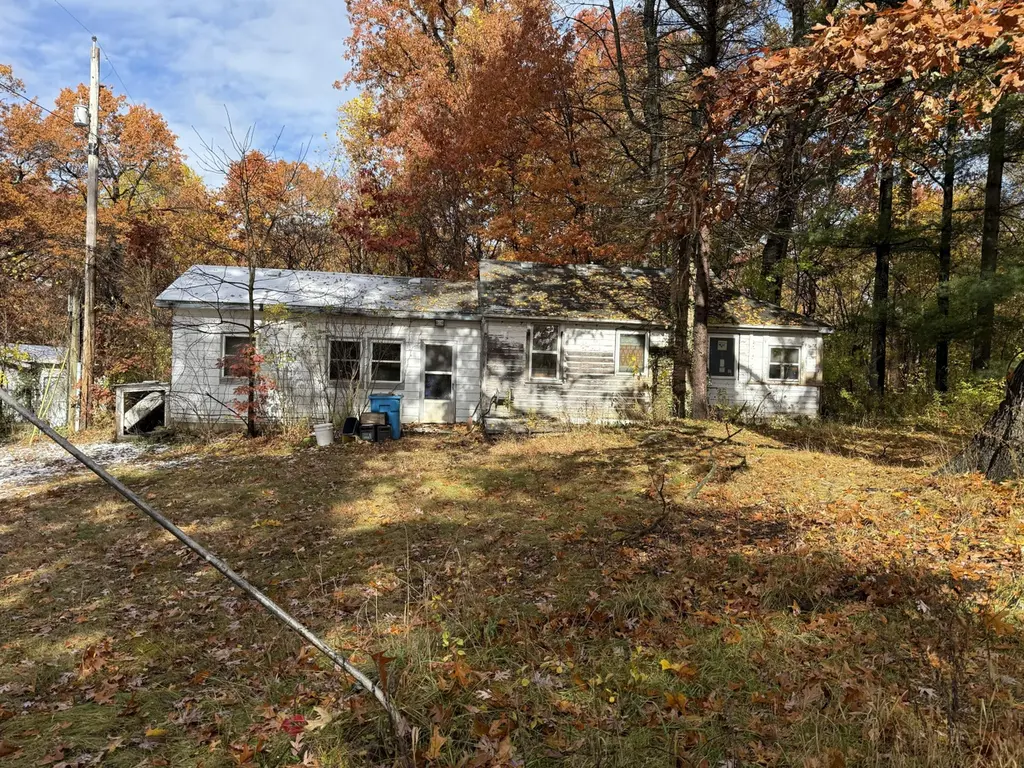
54483 Whitesell Dr
Chain-O-Lakes, IN 46628
$120,000C-
2 bd · 1.0 ba ·
804 sqft ·
Built 1939
· SingleFamily
· Active
· 212 DOM
Cashflow @ list (25.0% down · 7.5%)
Estimated rent
$1,231/mo
Mortgage (P&I)
−$629
Tax + insurance
−$191
HOA
−$0
Vac / Maint / Mgmt
−$258
Net cashflow
$152/mo
Annual
$1,830/yr
Cap rate
7.82%
Cash-on-cash
5.45%
DSCR
1.24
1% rule
1.03%
Cash to close
$33,600
Investor read
- This is a 2-bed/1.0-bath single-family listed at $120k.
- At list price, monthly cash flow is $152 ($2k/yr) — positive.
- The deal already cash-flows at list — no discount required.
- Meets the 1% rule at list price ($1k rent vs $120k).
- It's been on market 212 days — a 12% lower offer ($106k) is reasonable based on typical stale-listing flexibility.
- Recommended offer: $106k (12.0% below list) — sets the bar for market timing.
- Local home prices are declining (-3.0%/yr); year-one equity from $830 of loan paydown is wiped out by about $4k of value loss. Plan a longer hold.
- Location reads: area grade C — affects rentability + tenant quality, not the cash-flow math above.
- South Bend Community School Corporation (urban): math 12% / reading 21% proficiency, ranked #284 of 301 in IN (top 94%) — low school quality limits family demand, transient renter base, plan for 1-2y turnover; 66% free/reduced lunch — lower-income household profile, screen leases tightly.
- Zoned schools: Kennedy Academy (math 45% / reading 52%, grade D, #304 of 994 statewide, top 31%, 520 students, 61% FRL); Lasalle Academy (math 23% / reading 53%, grade F, #136 of 330 statewide, top 44%, 488 students, 56% FRL); Washington High School (math 12% / reading 42%, grade F, #315 of 369 statewide, top 86%, 834 students, 79% FRL) — zoned schools at 65% FRL track the district average.
- Zoned-school proficiency averages 38% at this address vs 16% district-wide (+21 pts) — the actual schools serving this property are materially stronger than the South Bend Community School Corporation average implies; a family-tenant draw the district grade alone would hide.
- Watch-outs: built in 1939 — expect roof / HVAC / electrical / plumbing capex.
- Market conditions: Rents rising fast (+6.8%/yr); 429 active listings in the ZIP; 754 units permitted in St. Joseph County in 2024 (460 in 5+ unit buildings).
- At projected returns (-3.0% appreciation + 6.8% rent growth), your $34k cash investment doubles in ~10 years — after that, you're playing with house money.
- Cap rate 7.8% vs local median 2.3% in Chain-O-Lakes — top-decile yield for the area; either an underpriced asset or a hidden risk that comps aren't pricing in. Stress-test before assuming the spread holds.
Questions for listing agent
- It's been on market 212 days. Have you received any prior offers? Is the seller open to a 12% concession, seller financing, or rate buy-down credit?
- Built in 1939 — when were the roof, HVAC, electrical panel, plumbing, and water heater last replaced?
- Why hasn't it sold? Are there any deal-killer items the seller is aware of (foundation, flood, title, zoning, code violations)?
- Is there a deadline driving the sale (1031 exchange, divorce, estate, relocation)? That informs how much negotiation room exists.
- What's the average days-on-market for RENTAL listings here right now (not sales)? A rising rental-DOM trend means longer vacancies and softer asking-rent achievability than the comps imply.
- What's the recent tenant-quality profile in this submarket — average credit score on applications, eviction rate, late-payment / NSF rate, and stable-employment percentage? A property-management company in the area should have these aggregated.
- How much new for-sale + rental construction is in the pipeline within 1–3 miles? Heavy new supply typically softens prices + rents 12–24 months out; constrained supply supports both.
CashFlowRE · CFR-YFXPMDDB3QPENP
· Data 13 h ago
cashflowre.app · 2026-05-29