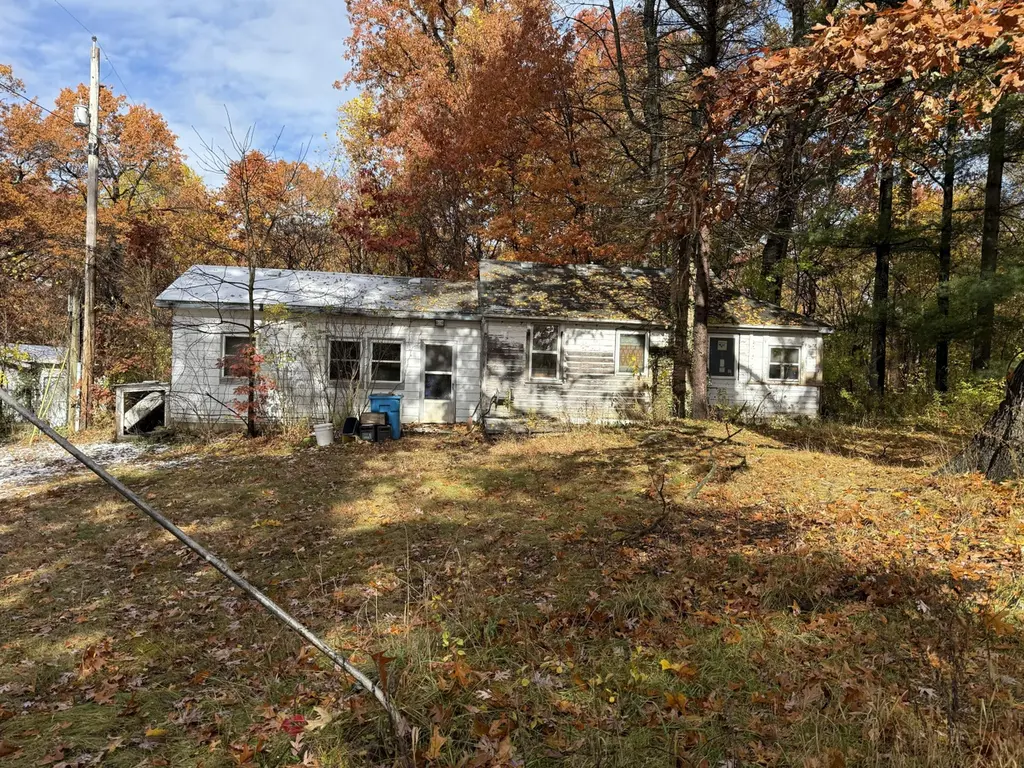
54483 Whitesell Dr · Chain-O-Lakes, IN
Flood risk 1/10 · Minimal
- FEMA flood zone
- X (unshaded)
- Chance of flooding over 30 yrs
- 0.0%
- Est. flood insurance / yr
- $507 – $1,088
Fire risk 1/10 · Minimal
- Est. fire insurance / yr
- $717 – $1,331
Heat risk 2/10 · Minimal
- Hot days now (above 99°F)
- 7 days/yr
- Hot days in 30 yrs
- 16 days/yr
Wind risk 2/10 · Minimal
- Chance of severe wind over 30 yrs
- —
Air-quality risk 2/10 · Minimal
- Unhealthy air days now
- 2 days/yr
- Unhealthy air days in 30 yrs
- 2 days/yr
Risk factors via First Street. Map © Google.
Why this score? — see what drove the C- grade
The composite is a weighted blend of 9 inputs, each scored 0–100. Each bar is that input's sub-score; the figure is the points it added to the 100-point composite (weight × sub-score).
- Cash flow +20.2/30.0
- ARV discount +9.1/15.0
- DSCR +6.4/10.0
- 1% rule +5.3/10.0
- Rent growth +4.2/5.0
- Livability +2.5/5.0
- Condition / age +2.5/5.0
- Schools +1.4/10.0
- Appreciation +0.0/10.0
$120,000
🖨 Deal sheet (PDF) 📄 Offer letter ✓ Due diligence
Listing remarks MLS
Situated right across the road from the Conservation Club, on just over 1/2 acre and over 100 ft of roadside frontage, This Bungalow offers 1 Bedroom and 1 Bathroom. The Septic was replaced in 2022. Some of the home has been remolded. The Shed needs some work. This could be your new lake get away, Schedule a showing today.
Key facts
- 1/2 acre
- Septic replaced
- Remodeled
Tags
Neighborhood map
What this means for you Summary
Snapshot
- This is a 2-bed/1.0-bath single-family listed at $120k.
Deal economics
- At list price, monthly cash flow is $152 ($2k/yr) — positive.
- The deal already cash-flows at list — no discount required.
- Meets the 1% rule at list price ($1k rent vs $120k).
- Recommended offer: $106k (12.0% below list) — sets the bar for market timing.
- Cap rate 7.8% vs local median 2.3% in Chain-O-Lakes — top-decile yield for the area; either an underpriced asset or a hidden risk that comps aren't pricing in. Stress-test before assuming the spread holds.
Location & tenants
- Location reads: area grade C — affects rentability + tenant quality, not the cash-flow math above.
- South Bend Community School Corporation (urban): math 12% / reading 21% proficiency, ranked #284 of 301 in IN (top 94%) — low school quality limits family demand, transient renter base, plan for 1-2y turnover; 66% free/reduced lunch — lower-income household profile, screen leases tightly.
- Zoned schools: Kennedy Academy (math 45% / reading 52%, grade D, #304 of 994 statewide, top 31%, 520 students, 61% FRL); Lasalle Academy (math 23% / reading 53%, grade F, #136 of 330 statewide, top 44%, 488 students, 56% FRL); Washington High School (math 12% / reading 42%, grade F, #315 of 369 statewide, top 86%, 834 students, 79% FRL) — zoned schools at 65% FRL track the district average.
- Zoned-school proficiency averages 38% at this address vs 16% district-wide (+21 pts) — the actual schools serving this property are materially stronger than the South Bend Community School Corporation average implies; a family-tenant draw the district grade alone would hide.
- Market conditions: Rents rising fast (+6.8%/yr); 429 active listings in the ZIP; 754 units permitted in St. Joseph County in 2024 (460 in 5+ unit buildings).
Forward outlook
- Local home prices are declining (-3.0%/yr); year-one equity from $830 of loan paydown is wiped out by about $4k of value loss. Plan a longer hold.
- At projected returns (-3.0% appreciation + 6.8% rent growth), your $34k cash investment doubles in ~10 years — after that, you're playing with house money.
Negotiation context
- It's been on market 212 days — a 12% lower offer ($106k) is reasonable based on typical stale-listing flexibility.
Risks & watch-outs
- Watch-outs: built in 1939 — expect roof / HVAC / electrical / plumbing capex.
Questions for the listing agent
- It's been on market 212 days. Have you received any prior offers? Is the seller open to a 12% concession, seller financing, or rate buy-down credit?
- Built in 1939 — when were the roof, HVAC, electrical panel, plumbing, and water heater last replaced?
- Why hasn't it sold? Are there any deal-killer items the seller is aware of (foundation, flood, title, zoning, code violations)?
- Is there a deadline driving the sale (1031 exchange, divorce, estate, relocation)? That informs how much negotiation room exists.
- What's the average days-on-market for RENTAL listings here right now (not sales)? A rising rental-DOM trend means longer vacancies and softer asking-rent achievability than the comps imply.
- What's the recent tenant-quality profile in this submarket — average credit score on applications, eviction rate, late-payment / NSF rate, and stable-employment percentage? A property-management company in the area should have these aggregated.
- How much new for-sale + rental construction is in the pipeline within 1–3 miles? Heavy new supply typically softens prices + rents 12–24 months out; constrained supply supports both.
Investment metrics
- 1% rule
- 1.03% ✓
- Cap rate
- 7.82%
- Cash-on-cash
- 5.45%
- DSCR
- 1.24
- GRM
- 8.1
CMA / ARV
- ARV (median comp)
- $124,468
- List price
- $120,000
- Delta
- -3.59%
- Verdict
- FAIR
- Comps
- 10 within 1.0 mi
Show comp detail 3 sales within ~0.75 mi
| Address | Dist | Beds/Ba | Sqft | Sold | Price | $/sf | Match |
|---|---|---|---|---|---|---|---|
| 54520 Norwood Dr | 0.07mi | 3/1.0 (+1) | 857 (+7%) | 4mo | $261,500 | $305 | 78 |
| 26077 Kenwood Dr | 0.17mi | 2/2.0 | 850 (+6%) | 2mo | $249,900 | $294 | 76 |
| 26666 Edison Rd | 0.65mi | 3/1.0 (+1) | 924 (+15%) | 2mo | $140,000 | $152 | 38 |
Match score weights: distance 35% · size 25% · config 20% · recency 20%. Top-matched comps best support the ARV.
Projected returns pro-forma
-3.0% appreciation · 6.78% rent growth · sell at horizon
- IRR
- -3.7%
- Equity multiple
- 0.86×
- Total profit
- $-4,863
- Equity at exit
- $17,892
- IRR
- 9.8%
- Equity multiple
- 1.89×
- Total profit
- $29,876
- Equity at exit
- $10,375
Cash invested: $33,600 (down + closing). Projections, not guarantees.
Landlord ↔ Tenant lean methodology
- Overall (STATE)
- 90 Strongly Landlord-Friendly
- State Indiana
- 90 Strongly Landlord-Friendly · R+11
- County
- — inherits STATE
- City
- — inherits STATE
ZIP-level market 46628
- Rents YoY
- 6.8%
- Active inventory
- 429
- Price-to-rent
- 8.1×
Monthly cashflow live
- Estimated rent
- $1,231 medium interval (Pro) →
- Mortgage (P&I)
- −$629
- Tax from tax record
- −$141 /mo · $1,688/yr
- Insurance
- −$50
- HOA
- −$0
- Vacancy / Maint / Mgmt
- −$258
- Net cashflow
- $152
Break-even live
Sensitivity live
| Price | -10% $220 | -5% $186 | +0% $152 | +5% $118 | +10% $85 |
|---|---|---|---|---|---|
| Rent | -10% $55 | -5% $104 | +0% $152 | +5% $201 | +10% $250 |
| Rate | -1.0pp $213 | -0.5pp $183 | base $152 | +0.5pp $121 | +1.0pp $90 |
UW: 25.0% down · 7.5% · 30yr · 1.5% tax · 5.0% vac · 8.0% maint · 8.0% mgmt
Financing live
Cash to close
- Down payment
- $30,000
- Closing costs
- $3,600
- Reserves months
- —
- Total cash needed
- —
Loan-product check · same deal, 3 products live
Conventional
25% down · 7.5% · 30yr
- Down + closing
- —
- Monthly P&I
- —
- Monthly cashflow
- —
- DSCR
- —
- Eligible?
- —
Personal DTI + credit; lowest rate.
DSCR
20% down · 8.5% · 30yr
- Down + closing
- —
- Monthly P&I
- —
- Monthly cashflow
- —
- DSCR
- —
- Eligible?
- —
No personal income docs; deal must DSCR.
Hard money
10% down · 12.0% · 12mo
- Down + closing
- —
- Monthly P&I
- —
- Monthly cashflow
- —
- DSCR
- —
- Eligible?
- —
Short-term bridge; refi at stabilization.
Listing history 16 events
-
2026-06-22days on market $120,000 Active 212 DOM
-
2026-06-18days on market $120,000 Active 209 DOM
-
2026-06-17days on market $120,000 Active 208 DOM
-
2026-06-16days on market $120,000 Active 207 DOM
-
2026-06-15days on market $120,000 Active 206 DOM
-
2026-06-14days on market $120,000 Active 204 DOM
-
2026-06-13days on market $120,000 Active 203 DOM
-
2026-06-10days on market $120,000 Active 201 DOM
-
2026-06-09days on market $120,000 Active 200 DOM
-
2026-06-08days on market $120,000 Active 199 DOM
-
2026-06-07days on market $120,000 Active 198 DOM
-
2026-06-03days on market $120,000 Active 194 DOM
-
2026-06-02days on market $120,000 Active 193 DOM
-
2026-06-01days on market $120,000 Active 192 DOM
-
2026-05-31days on market $120,000 Active 191 DOM
-
2025-11-20$120,000 Active 324-char remark
Show marketing remark (324 chars)
Situated right across the road from the Conservation Club, on just over 1/2 acre and over 100 ft of roadside frontage, This Bungalow offers 1 Bedroom and 1 Bathroom. The Septic was replaced in 2022. Some of the home has been remolded. The Shed needs some work. This could be your new lake get away, Schedule a showing today.
ⓘ Source: listings_history table (triggers on properties + properties_extension) + one-shot
backfill from property_details.listing_events for pre-trigger history.
Tax reassessment forecast IN · Partial reset (capped growth)
- Current annual tax
- $1,688 · $141/mo
- Projected year-2 tax
- $1,688 · $141/mo
- Expected delta
- $0/yr ($0/mo · 0.0%)
ⓘ Screening estimate from a state-policy table — verify with the county assessor before closing.
Climate risk First Street
- Flood 1/10 Low FEMA zone X (unshaded) · 0% chance over 30 yrs
- Wildfire 1/10 Low
- Heat 2/10 Low 7 d/yr ≥99°F today · 16 d/yr by 30 yrs out
- Wind 2/10 Low
- Air quality 2/10 Low 2 unhealthy d/yr today · 2 by 30 yrs out
Nearby sold comps map
Loading sold comps map…
Walkable amenities ~0.75 mi
Loading nearby amenities…
Taxation est. · year 1
- Rental income
- $14,771
- − Mortgage interest
- −$6,722
- − Property taxes
- −$1,688
- − Insurance
- −$600
- − Repairs & maintenance
- −$1,182
- − Management
- −$1,182
- − Depreciation
- −$3,491
- Taxable loss
- −$93
- Est. tax savings @ 24.0%
- +$22
- After-tax cash flow
- $1,852/yr
For passive investors: Depreciation is non-cash, so a rental often shows a tax loss while cash-flowing — sheltering income. Rental losses are passive: they offset passive income freely, and up to $25,000/yr can offset ordinary (W-2) income if you actively participate and your MAGI is under $100k (phasing out to $0 by $150k); unused losses carry forward. On sale, claimed depreciation is recaptured at up to 25%, and gains may owe capital-gains tax (a 1031 exchange can defer both). Figures are a year-1 estimate at your 24.0% rate — not tax advice; consult a CPA.
Schools (NCES district)
- District
- South Bend Community School Corporation
- NCES district ID
- 1810290
- Math proficiency
- 12% ▼ -10.00%
- Reading proficiency
- 21% ▼ -6.00%
- Median HH income
- $41,935
- Composite
- 14.21/100
- National rank
- #9452
- State rank
- #284 of 301 in IN
Livability — Chain-O-Lakes
No livability data for this city. (Only ~50 U.S. cities are tracked.)
Census & demographics
- Census place
- Chain-O-Lakes, IN
- County
- Saint Joseph County · 189,048 people
- City population
- 99,767
- Metro
- South Bend-Mishawaka, IN-MI
- Population (ZIP)
- 27,685
- Household income
- $61,759
- Rent vs Own
- Severe rent burden
- 1024.0
Population outlook (St. Joseph County) Hauer SSP2
- Today (2025)
- 273,186 people
- By 2030
- 273,594 · +0.1%
- By 2040
- 271,641 · -0.6%
- By 2050
- 269,187 · -1.5%
- By 2075
- 263,136 · -3.7%
- By 2100
- 245,659 · -10.1%
Race, ethnicity, and origin ACS 2023
- Neighborhood character
- Diverse neighborhood (Simpson 0.60)
- Race & ethnicity
- White 55% Black 30% Hispanic / Latino 10% Two or more races 8%
- Hispanic origin (detail)
- Mexican 8%
- Common ancestry
- Romanian 12% Lithuanian 1% Slovak 1%
- Foreign-born
- 7% · Canada, China
- Languages at home
- 89% English-only · Spanish 7% Russian/Polish/Slavic 1%
Political lean MEDSL · St. Joseph
- 2024 margin
- Toss-up / Even · D 50.0% · R 48.5% · Other 1.5%
- 2008→2024 swing
- -15.6pp toward R · 2008: 17.1pp · 2024: 1.5pp
- All cycles
- 2024: D+1.5 2020: D+5.8 2016: D+0.2 2012: D+3.5 2008: D+17.1
Not yet ingested
- Civics
- —
Market trends
- HPI YoY
- ▼ -130.47%
- Current HPI
- 202.112
- Rent YoY
- ▲ 6.78%
- Metro
- South Bend-Mishawaka, IN-MI
- State GDP YoY
- ▲ 2.90%
- F500 in state
- 18
Industry mix (Fortune 500 HQ in IN)
| Industry | F500 HQs | Revenue |
|---|---|---|
| Industrial Machinery | 2 | $37B |
|
||
| Healthcare | 1 | $177B |
|
||
| Pharmaceuticals | 1 | $45B |
|
||
| Metals / Steel | 1 | $18B |
|
||
| Agriculture | 1 | $17B |
|
||
| Packaging | 1 | $12B |
|
||
Price history
1 event — show timeline
- 2025-11-20 Listed $120,000 NIRA MLS as Distributed by MLS Grid
Property tax history
+9.2%/yrLatest (2023): $1,688 · -0.7% YoY. Source: county tax records.
Cash-flow waterfall
monthlySold comps — $/sqft
last 12 mo · ≤1 miLoading sold comps…