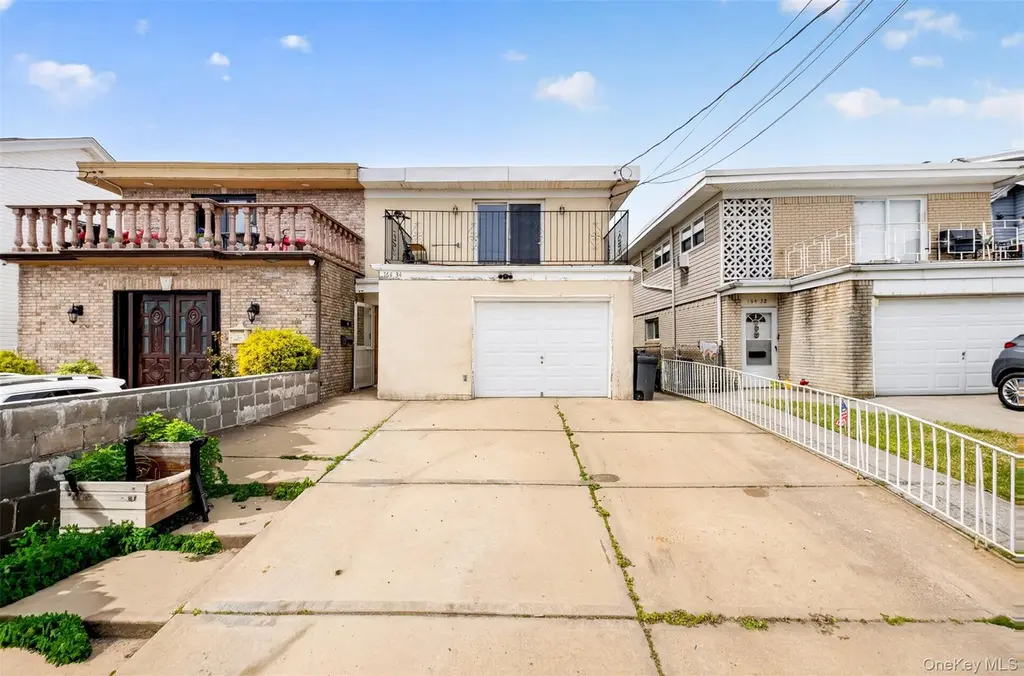
16434 99th St
New York, NY 11414
$880,000D-
6 bd · 0.0 ba ·
1,720 sqft ·
Built 1950
· MultiFamily
· Pending
· 23 DOM
Cashflow @ list (25.0% down · 7.5%)
Estimated rent
$6,933/mo
Mortgage (P&I)
−$4,615
Tax + insurance
−$954
HOA
−$0
Vac / Maint / Mgmt
−$1,456
Net cashflow
$-92/mo
Annual
$-1,100/yr
Cap rate
6.26%
Cash-on-cash
-0.12%
DSCR
0.99
1% rule
0.79%
Cash to close
$246,400
Investor read
- This is a 2 × 3-bed/?-bath units multifamily listed at $880k.
- At list price, monthly cash flow is $-92 ($-1k/yr) — negative. Per door: $-46/mo.
- To cash-flow at today's rent, offer at most $864k (1.8% below list).
- To meet the 1% rule (rent ≥ 1% of price), the offer needs to be $693k (21.2% below list).
- It's been on market 23 days — a 2% lower offer ($867k) is reasonable based on typical stale-listing flexibility.
- Recommended offer: $693k (21.2% below list) — sets the bar for 1% rule.
- Local home prices are declining (-3.0%/yr); year-one equity from $6k of loan paydown is wiped out by about $26k of value loss. Plan a longer hold.
- Location reads 75/100 on livability (#268 in NY, #4,188 nationally) — a middle-class / working-renter tenant base. Strengths: amenities A+, commute A+, health & safety A; Watch: crime F, cost of living F.
- Watch-outs: flood insurance adds $66/mo; built in 1950 — expect roof / HVAC / electrical / plumbing capex.
- Market conditions: 258 active listings in the ZIP; solid renter incomes; 5,302 units permitted in Queens County in 2024 (4,918 in 5+ unit buildings).
- Queens County population projected at +16% by 2050 — long-run rental-demand tailwind backs the buy-and-hold thesis.
- 2 sale attempts since 9y ago with the ask held roughly flat each time — persistent listings suggest the price (not the market) is what's stuck; bring a comps-based counter.
- Current owner paid $639k; 38% above their basis — modest negotiation headroom, anchor on the comps not their cost.
- Climate carrying-cost: severe flood risk; major wind risk, 75% chance of damaging wind over 30y; moderate wildfire risk; extreme-heat days projected 7→16/yr by 2055 (HVAC capex compounding) — expect insurance premiums to compound above CPI over the hold.
- Cap rate 6.3% vs local median 2.6% in New York — top-decile yield for the area; either an underpriced asset or a hidden risk that comps aren't pricing in. Stress-test before assuming the spread holds.
- At $6,933/mo this rent would consume 88% of the median local household income ($95k/yr) (locally 985% of renters already pay >50% of income on rent) — very limited rent-growth headroom before tenants either downsize or default.
Questions for listing agent
- What do current leases actually rent for vs. the listed asking? Can we see a recent rent roll and the last 12 months of T-12 income?
- Can we see the unit-by-unit rent roll, current vacancy, and any below-market leases? What's the average tenancy length?
- What capital expenditures (roof, boiler, parking lot, exteriors) have been made in the last 5 years, and what's planned in the next 2?
- Built in 1950 — when were the roof, HVAC, electrical panel, plumbing, and water heater last replaced?
- What's the actual annual flood-insurance premium (NFIP or private), and is the property in a SFHA with mandatory coverage?
- Is there a deadline driving the sale (1031 exchange, divorce, estate, relocation)? That informs how much negotiation room exists.
- Schools are B-rated — typically a magnet for longer-tenancy family renters. What's the average tenant stay here, and is there a school-zone premium baked into asking?
- Crime grade is F in this area — have there been break-ins, vandalism, or insurance claims at this property in the last 3 years? What carrier currently insures it and at what premium?
CashFlowRE · CFR-YHCV2R540JX2KZ
· Data 3 weeks ago
cashflowre.app · 2026-05-29