 Duplex
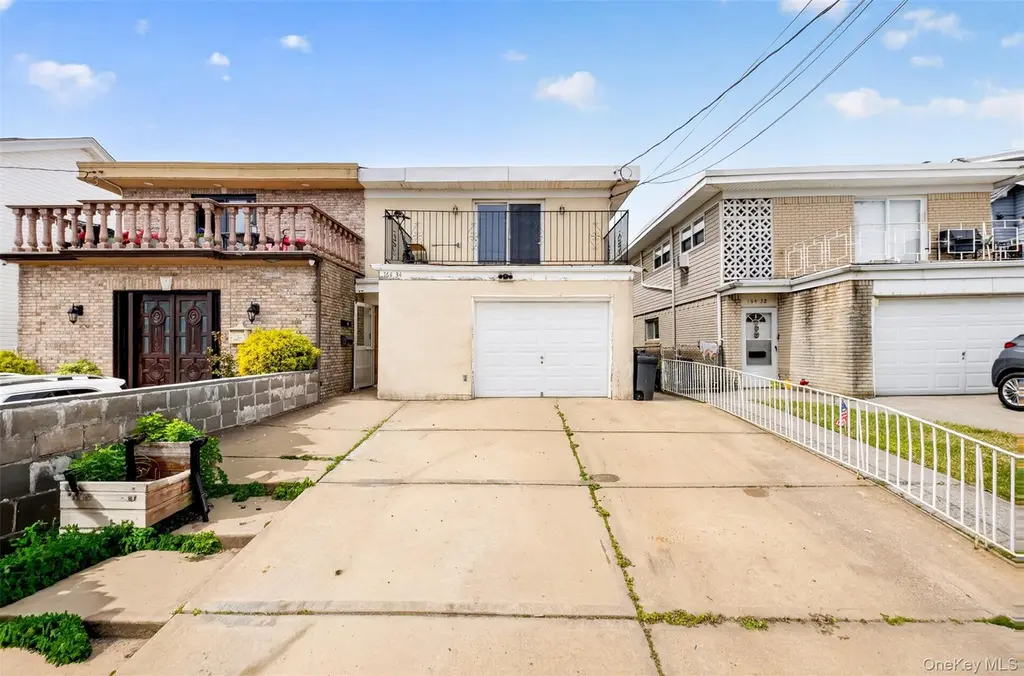
16434 99th St · New York, NY
Flood risk 8/10 · Major
- FEMA flood zone
- X (shaded)
- Chance of flooding over 30 yrs
- 0.99%
- Est. flood insurance / yr
- $507 – $1,088
Fire risk 5/10 · Moderate
- Est. fire insurance / yr
- $691 – $1,283
Heat risk 6/10 · Moderate
- Hot days now (above 98°F)
- 7 days/yr
- Hot days in 30 yrs
- 16 days/yr
Wind risk 6/10 · Moderate
- Chance of severe wind over 30 yrs
- 75.0%
Air-quality risk 4/10 · Minor
- Unhealthy air days now
- 6 days/yr
- Unhealthy air days in 30 yrs
- 6 days/yr
Risk factors via First Street. Map © Google.
Why this score? — see what drove the D- grade
The composite is a weighted blend of 9 inputs, each scored 0–100. Each bar is that input's sub-score; the figure is the points it added to the 100-point composite (weight × sub-score).
- Cash flow +13.1/30.0
- Schools +5.0/10.0
- DSCR +3.9/10.0
- Livability +3.8/5.0
- 1% rule +2.9/10.0
- Rent growth +2.5/5.0
- Condition / age +2.5/5.0
- ARV discount +1.9/15.0
- Appreciation +0.0/10.0
$880,000
🖨 Deal sheet 📄 Offer letter ✓ Due diligence
Multi-family units
County records classify this as Multi-Family (2-4 Unit). Listing-text estimate: 2 units. confirmed
Listing remarks MLS
Legal 2 Family Semi-Detached In Howard Beach. 3 Bed Over 2 Bed In Excellent Condition. Seperate Heat, Hot Water, And Electric For Each Apt. 25X100 With Private Drive And Oversized 1 Car Garage. Back Yard With Large Shed With Electric., Additional information: Appearance:Excellent,Separate Hotwater Heater:2
Key facts
- Two-family residence
- Private garage
- Prime neighborhood
Tags
Property features AI
Finance
- Other: Building total area 1870; Property located in Queens County
Exterior
- Parking: Driveway; Garage (1 space); No carport
- Utilities: Public sewer; Natural gas available; See remarks for additional utility details
- Home design: Duplex
- Construction: Duplex construction
- Exterior features: Not waterfront; Other construction materials; Other foundation type
Interior
- Kitchen: Eat-in kitchen; Open kitchen
- Bedrooms: One 4-bedroom unit
- Heating & cooling: Baseboard heating; Wall/window air conditioning units
- Interior features: Eat-in kitchen; Natural woodwork; Open kitchen; Storage space
Neighborhood map
What this means for you Summary
Snapshot
- This is a 2 × 3-bed/?-bath units multifamily listed at $880k.
Deal economics
- At list price, monthly cash flow is $-92 ($-1k/yr) — negative. Per door: $-46/mo.
- To cash-flow at today's rent, offer at most $864k (1.8% below list).
- To meet the 1% rule (rent ≥ 1% of price), the offer needs to be $693k (21.2% below list).
- Recommended offer: $693k (21.2% below list) — sets the bar for 1% rule.
- Cap rate 6.3% vs local median 2.6% in New York — top-decile yield for the area; either an underpriced asset or a hidden risk that comps aren't pricing in. Stress-test before assuming the spread holds.
Location & tenants
- Location reads 75/100 on livability (#268 in NY, #4,188 nationally) — a middle-class / working-renter tenant base. Strengths: amenities A+, commute A+, health & safety A; Watch: crime F, cost of living F.
- Market conditions: 258 active listings in the ZIP; solid renter incomes; 5,302 units permitted in Queens County in 2024 (4,918 in 5+ unit buildings).
- At $6,933/mo this rent would consume 88% of the median local household income ($95k/yr) (locally 985% of renters already pay >50% of income on rent) — very limited rent-growth headroom before tenants either downsize or default.
Forward outlook
- Local home prices are declining (-3.0%/yr); year-one equity from $6k of loan paydown is wiped out by about $26k of value loss. Plan a longer hold.
- Queens County population projected at +16% by 2050 — long-run rental-demand tailwind backs the buy-and-hold thesis.
Negotiation context
- It's been on market 23 days — a 2% lower offer ($867k) is reasonable based on typical stale-listing flexibility.
- 2 sale attempts since 9y ago with the ask held roughly flat each time — persistent listings suggest the price (not the market) is what's stuck; bring a comps-based counter.
- Current owner paid $639k; 38% above their basis — modest negotiation headroom, anchor on the comps not their cost.
Risks & watch-outs
- Watch-outs: flood insurance adds $66/mo; built in 1950 — expect roof / HVAC / electrical / plumbing capex.
- Climate carrying-cost: severe flood risk; major wind risk, 75% chance of damaging wind over 30y; moderate wildfire risk; extreme-heat days projected 7→16/yr by 2055 (HVAC capex compounding) — expect insurance premiums to compound above CPI over the hold.
Questions for the listing agent
- What do current leases actually rent for vs. the listed asking? Can we see a recent rent roll and the last 12 months of T-12 income?
- Can we see the unit-by-unit rent roll, current vacancy, and any below-market leases? What's the average tenancy length?
- What capital expenditures (roof, boiler, parking lot, exteriors) have been made in the last 5 years, and what's planned in the next 2?
- Built in 1950 — when were the roof, HVAC, electrical panel, plumbing, and water heater last replaced?
- What's the actual annual flood-insurance premium (NFIP or private), and is the property in a SFHA with mandatory coverage?
- Is there a deadline driving the sale (1031 exchange, divorce, estate, relocation)? That informs how much negotiation room exists.
- Schools are B-rated — typically a magnet for longer-tenancy family renters. What's the average tenant stay here, and is there a school-zone premium baked into asking?
- Crime grade is F in this area — have there been break-ins, vandalism, or insurance claims at this property in the last 3 years? What carrier currently insures it and at what premium?
- The area grade is low — what's the realistic commute time and amenity access for the typical tenant pool here? Any planned neighborhood developments (good or bad) we should know about?
- What's the average days-on-market for RENTAL listings here right now (not sales)? A rising rental-DOM trend means longer vacancies and softer asking-rent achievability than the comps imply.
- What's the recent tenant-quality profile in this submarket — average credit score on applications, eviction rate, late-payment / NSF rate, and stable-employment percentage? A property-management company in the area should have these aggregated.
- How much new apartment / multifamily construction is in the pipeline within 1–3 miles? Heavy new supply (>2% of stock underway) typically softens rents 12–24 months out; light construction supports rent growth.
Investment metrics
- 1% rule
- 0.79% ✗
- Cap rate
- 6.26%
- Cash-on-cash
- -0.12%
- DSCR
- 0.99
- GRM
- 10.6
CMA / ARV
- ARV (on-the-fly)
- $782,600
- Comps found
- 1
Show comp detail 1 sale within ~0.75 mi
| Address | Dist | Beds/Ba | Sqft | Sold | Price | $/sf | Match |
|---|---|---|---|---|---|---|---|
| 96-20 160th Ave | 0.54mi | 5/2.0 (-1) | 1,911 (+11%) | 3mo | $870,000 | $455 | 41 |
Match score weights: distance 35% · size 25% · config 20% · recency 20%. Top-matched comps best support the ARV.
Projected returns pro-forma
-3.0% appreciation · 3.0% rent growth · sell at horizon
- IRR
- -17.1%
- Equity multiple
- 0.40×
- Total profit
- $-148,645
- Equity at exit
- $131,211
- IRR
- -9.0%
- Equity multiple
- 0.44×
- Total profit
- $-137,808
- Equity at exit
- $76,086
Cash invested: $246,400 (down + closing). Projections, not guarantees.
Landlord ↔ Tenant lean methodology
- Overall (CITY)
- 0 Strongly Tenant-Friendly
- State New York
- 15 Strongly Tenant-Friendly · D+10
- County
- — inherits STATE
- City New York
- 0 Strongly Tenant-Friendly · D+34
ZIP-level market 11414
- Active inventory
- 258
- Price-to-rent
- 21.2×
Monthly cashflow live
- Estimated rent
- $6,933 medium interval (Pro) →
- Mortgage (P&I)
- −$4,615
- Tax from tax record
- −$521 /mo · $6,249/yr
- Insurance
- −$367
- Flood insurance flood zone
- −$66 /mo · $798/yr
- HOA
- −$0
- Vacancy / Maint / Mgmt
- −$1,456
- Net cashflow
- $-92
Break-even live
2-unit breakdown (identical units grouped — click to expand)
| Units | Beds | Baths | Est. rent |
|---|---|---|---|
| 2× units | 3 | — | $6,932 |
| #1 | 3 | — | $3,466 |
| #2 | 3 | — | $3,466 |
| Total (2 units) | $6,933 | ||
UW: 25.0% down · 7.5% · 30yr · 1.5% tax · 5.0% vac · 8.0% maint · 8.0% mgmt
Financing live
Cash to close
- Down payment
- $220,000
- Closing costs
- $26,400
- Reserves months
- —
- Total cash needed
- —
Loan-product check · same deal, 3 products live
Conventional
25% down · 7.5% · 30yr
- Down + closing
- —
- Monthly P&I
- —
- Monthly cashflow
- —
- DSCR
- —
- Eligible?
- —
Personal DTI + credit; lowest rate.
DSCR
20% down · 8.5% · 30yr
- Down + closing
- —
- Monthly P&I
- —
- Monthly cashflow
- —
- DSCR
- —
- Eligible?
- —
No personal income docs; deal must DSCR.
Hard money
10% down · 12.0% · 12mo
- Down + closing
- —
- Monthly P&I
- —
- Monthly cashflow
- —
- DSCR
- —
- Eligible?
- —
Short-term bridge; refi at stabilization.
Listing history 8 events
-
2026-05-22status Pending
-
2026-04-29$880,000 Active
-
2018-01-22soldstatus $639,000
-
2018-01-12soldstatus $639,000 Closed 307-char remark
Show marketing remark (307 chars)
Legal 2 Family Semi-Detached In Howard Beach. 3 Bed Over 2 Bed In Excellent Condition. Seperate Heat, Hot Water, And Electric For Each Apt. 25X100 With Private Drive And Oversized 1 Car Garage. Back Yard With Large Shed With Electric., Additional information: Appearance:Excellent,Separate Hotwater Heater:2
-
2017-09-29status Under Contract 307-char remark
Show marketing remark (307 chars)
Legal 2 Family Semi-Detached In Howard Beach. 3 Bed Over 2 Bed In Excellent Condition. Seperate Heat, Hot Water, And Electric For Each Apt. 25X100 With Private Drive And Oversized 1 Car Garage. Back Yard With Large Shed With Electric., Additional information: Appearance:Excellent,Separate Hotwater Heater:2
-
2017-08-21$679,000 New 307-char remark
Show marketing remark (307 chars)
Legal 2 Family Semi-Detached In Howard Beach. 3 Bed Over 2 Bed In Excellent Condition. Seperate Heat, Hot Water, And Electric For Each Apt. 25X100 With Private Drive And Oversized 1 Car Garage. Back Yard With Large Shed With Electric., Additional information: Appearance:Excellent,Separate Hotwater Heater:2
-
1994-06-01soldstatus $230,000
-
1985-05-30soldstatus $160,000
ⓘ Source: listings_history table (triggers on properties + properties_extension) + one-shot
backfill from property_details.listing_events for pre-trigger history.
Tax reassessment forecast NY · Partial reset (capped growth)
- Current annual tax
- $6,249 · $521/mo
- Projected year-2 tax
- $10,561 · $880/mo
- Expected delta
- +$4,311/yr (+$359/mo · 69.0%)
ⓘ Screening estimate from a state-policy table — verify with the county assessor before closing.
Climate risk First Street
- Flood 8/10 Severe FEMA zone X (shaded) · 99% chance over 30 yrs
- Wildfire 5/10 Major
- Heat 6/10 Major 7 d/yr ≥98°F today · 16 d/yr by 30 yrs out
- Wind 6/10 Major 75% chance of damaging wind over 30 yrs
- Air quality 4/10 Moderate 6 unhealthy d/yr today · 6 by 30 yrs out
Nearby sold comps map
Loading sold comps map…
Walkable amenities ~0.75 mi
Loading nearby amenities…
Taxation est. · year 1
- Rental income
- $83,196
- − Mortgage interest
- −$49,294
- − Property taxes
- −$6,249
- − Insurance
- −$5,198
- − Repairs & maintenance
- −$6,656
- − Management
- −$6,656
- − Depreciation
- −$25,600
- Taxable loss
- −$16,456
- Est. tax savings @ 24.0%
- +$3,949
- After-tax cash flow
- $2,850/yr
For passive investors: Depreciation is non-cash, so a rental often shows a tax loss while cash-flowing — sheltering income. Rental losses are passive: they offset passive income freely, and up to $25,000/yr can offset ordinary (W-2) income if you actively participate and your MAGI is under $100k (phasing out to $0 by $150k); unused losses carry forward. On sale, claimed depreciation is recaptured at up to 25%, and gains may owe capital-gains tax (a 1031 exchange can defer both). Figures are a year-1 estimate at your 24.0% rate — not tax advice; consult a CPA.
Schools (NCES district)
No district data.
Livability — New York
- Score
- 75/100
- State rank
- #268
- US rank
- #4188
Category grades
Schools grade is shown separately in the Schools card above.
Census & demographics
- Census place
- New York, NY
- County
- Queens County · 1,914,869 people
- City population
- 7,731,280
- Metro
- New York-Newark-Jersey City, NY-NJ-PA
- Population (ZIP)
- 31,308
- Household income
- $95,051
- Rent vs Own
- Severe rent burden
- 985.0
Population outlook (Queens County) Hauer SSP2
- Today (2025)
- 2,546,320 people
- By 2030
- 2,643,059 · +3.8%
- By 2040
- 2,815,563 · +10.6%
- By 2050
- 2,944,423 · +15.6%
- By 2075
- 3,123,338 · +22.7%
- By 2100
- 3,098,688 · +21.7%
Race, ethnicity, and origin ACS 2023
- Neighborhood character
- Diverse neighborhood (Simpson 0.56)
- Race & ethnicity
- White 61% Hispanic / Latino 25% Two or more races 13% Black 5% Asian 5%
- Hispanic origin (detail)
- Puerto Rican 11% Dominican 6%
- Common ancestry
- Romanian 4% Scotch-Irish 1%
- Foreign-born
- 20% · Canada, Jamaica, China
- Languages at home
- 63% English-only · Spanish 17% Other Indo-European 14% Russian/Polish/Slavic 2%
Political lean MEDSL · Queens
- 2024 margin
- Strong D (+24.6) · D 62.3% · R 37.7%
- 2008→2024 swing
- -26.2pp toward R · 2008: 50.8pp · 2024: 24.6pp
- All cycles
- 2024: D+24.6 2020: D+45.2 2016: D+53.4 2012: D+58.5 2008: D+50.8
Not yet ingested
- Civics
- —
Market trends
- HPI YoY
- ▼ -227.02%
- Current HPI
- 206.6334
- Rent YoY
- —
- Metro
- New York-Newark-Jersey City, NY-NJ-PA
- State GDP YoY
- ▲ 2.60%
- F500 in state
- 92
Industry mix (Fortune 500 HQ in NY)
| Industry | F500 HQs | Revenue |
|---|---|---|
| Financial Services | 10 | $950B |
|
||
| Consumer Goods | 9 | $162B |
|
||
| Insurance | 4 | $225B |
|
||
| Telecommunications | 2 | $144B |
|
||
| Pharmaceuticals | 2 | $112B |
|
||
| Media / Entertainment | 2 | $69B |
|
||
Price history
+450.0% since first listed8 events — show timeline
- 2026-05-22 Pending — OneKey® MLS as Distributed by MLS Grid
- 2026-04-29 Listed $880,000 OneKey® MLS as Distributed by MLS Grid
- 2018-01-22 Sold (Public Records) $639,000 Public Records
- 2018-01-12 Sold (MLS) $639,000 OneKey® MLS as Distributed by MLS Grid
- 2017-09-29 Pending — OneKey® MLS as Distributed by MLS Grid
- 2017-08-21 Listed $679,000 OneKey® MLS as Distributed by MLS Grid
- 1994-06-01 Sold (Public Records) $230,000 Public Records
- 1985-05-30 Sold (Public Records) $160,000 Public Records
Property tax history
+3.0%/yrLatest (2025): $6,249 · -2.4% YoY. Source: county tax records.
Cash-flow waterfall
monthlySold comps — $/sqft
last 12 mo · ≤1 miLoading sold comps…