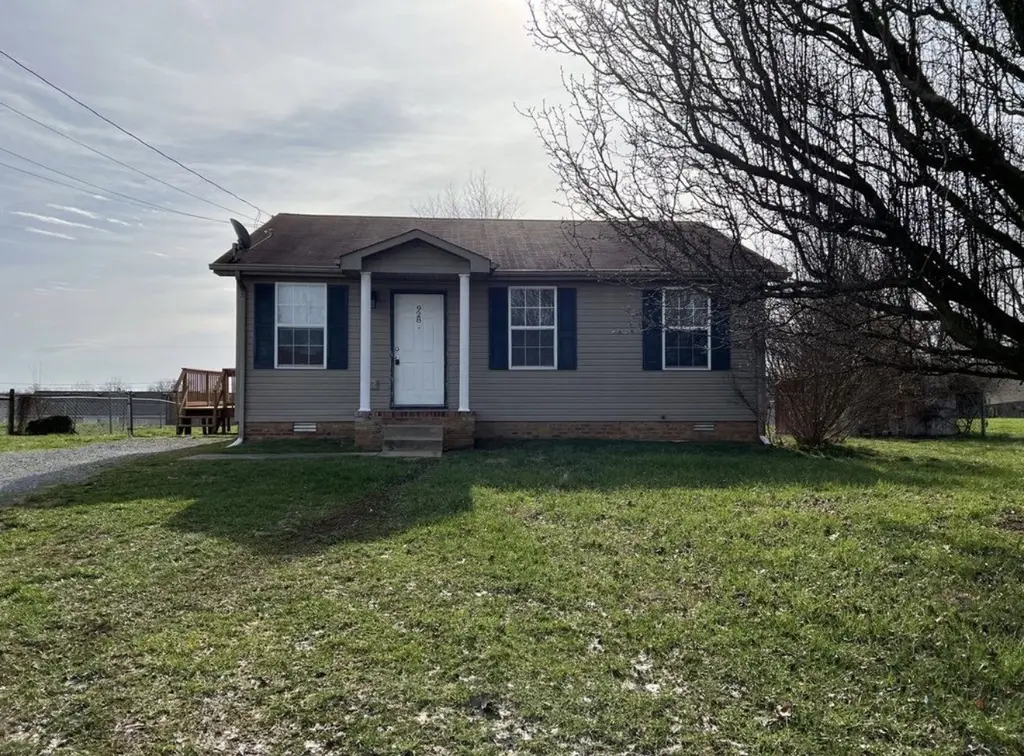
928 Van Buren Ave
Oak Grove, KY 42262
$149,900C
3 bd · 1.5 ba ·
720 sqft ·
Built 1997
· SingleFamily
· Pending
· 26 DOM
Cashflow @ list (25.0% down · 7.5%)
Estimated rent
$1,318/mo
Mortgage (P&I)
−$786
Tax + insurance
−$128
HOA
−$0
Vac / Maint / Mgmt
−$277
Net cashflow
$127/mo
Annual
$1,526/yr
Cap rate
7.31%
Cash-on-cash
3.64%
DSCR
1.16
1% rule
0.88%
Cash to close
$41,972
Investor read
- This is a 3-bed/1.5-bath single-family listed at $150k.
- At list price, monthly cash flow is $127 ($2k/yr) — positive.
- The deal already cash-flows at list — no discount required.
- To meet the 1% rule (rent ≥ 1% of price), the offer needs to be $132k (12.1% below list).
- It's been on market 26 days — a 2% lower offer ($148k) is reasonable based on typical stale-listing flexibility.
- Recommended offer: $132k (12.1% below list) — sets the bar for 1% rule.
- In year one you build about $2k of equity ($1k loan paydown + $1k appreciation (0.9% local appreciation)).
- Location reads 57/100 on livability (#445 in KY) — a working-class tenant base; expect higher turnover. Strengths: cost of living A+, housing A+; Watch: crime C-, schools F, amenities F.
- Christian County (town): math 30% / reading 34% proficiency, ranked #93 of 165 in KY (top 56%) — families likely to look elsewhere, expect single-tenant / working-renter base with shorter leases; 61% free/reduced lunch — lower-income household profile, screen leases tightly.
- Market conditions: Rents flat; 83 active listings in the ZIP; 193 units permitted in Christian County in 2024 (66 in 5+ unit buildings).
- Christian County population projected at -20% by 2050 — secular population decline; favor cash flow + early exit over multi-decade hold.
- 9 sale attempts since 13y ago; this cycle's ask has dropped $15k (9%) from the opening price — seller is motivated, your offer sets the floor, not the list.
- Current owner paid $52k; list at $150k implies a 188% gain — meaningful room to come down on a strong offer.
- At projected returns (0.9% appreciation + 0.0% rent growth), your $42k cash investment doubles in ~10 years — after that, you're playing with house money.
- Climate carrying-cost: extreme-heat days projected 7→20/yr by 2055 (HVAC capex compounding) — expect insurance premiums to compound above CPI over the hold.
- Cap rate 7.3% vs local median 3.5% in Oak Grove — top-decile yield for the area; either an underpriced asset or a hidden risk that comps aren't pricing in. Stress-test before assuming the spread holds.
- This rent runs 30% of the median local income ($52k/yr) — at the standard rent-burdened threshold; future hikes will face affordability resistance.
Questions for listing agent
- Is there a deadline driving the sale (1031 exchange, divorce, estate, relocation)? That informs how much negotiation room exists.
- Schools are F-rated, which usually means shorter tenancies and higher turnover. Who's the typical renter profile here, and what's been the actual vacancy rate?
- What's the average days-on-market for RENTAL listings here right now (not sales)? A rising rental-DOM trend means longer vacancies and softer asking-rent achievability than the comps imply.
- What's the recent tenant-quality profile in this submarket — average credit score on applications, eviction rate, late-payment / NSF rate, and stable-employment percentage? A property-management company in the area should have these aggregated.
- How much new for-sale + rental construction is in the pipeline within 1–3 miles? Heavy new supply typically softens prices + rents 12–24 months out; constrained supply supports both.
CashFlowRE · CFR-YHM8M50MZ7AYKP
· Data 1 week ago
cashflowre.app · 2026-05-29