 🏷️ Likely Rental
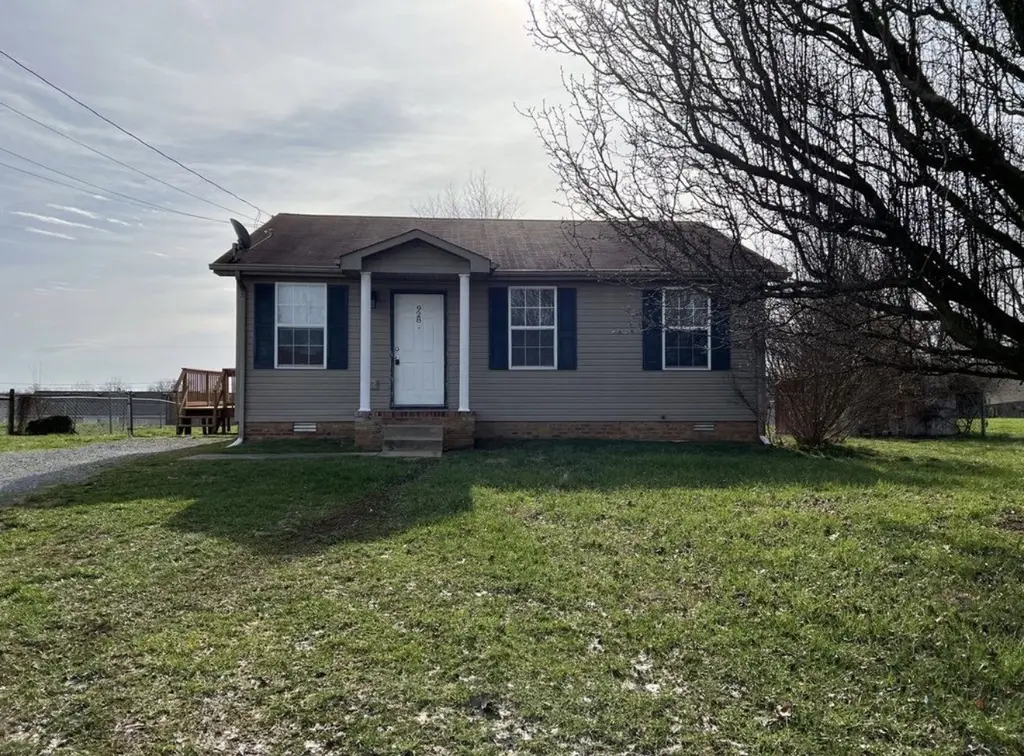
928 Van Buren Ave · Oak Grove, KY
Flood risk 1/10 · Minimal
- FEMA flood zone
- X (unshaded)
- Chance of flooding over 30 yrs
- 0.0%
- Est. flood insurance / yr
- $507 – $1,088
Fire risk 1/10 · Minimal
- Est. fire insurance / yr
- $839 – $1,559
Heat risk 5/10 · Moderate
- Hot days now (above 107°F)
- 7 days/yr
- Hot days in 30 yrs
- 20 days/yr
Wind risk 4/10 · Minor
- Chance of severe wind over 30 yrs
- 10.0%
Air-quality risk 2/10 · Minimal
- Unhealthy air days now
- 1 days/yr
- Unhealthy air days in 30 yrs
- 2 days/yr
Risk factors via First Street. Map © Google.
Why this score? — see what drove the C grade
The composite is a weighted blend of 9 inputs, each scored 0–100. Each bar is that input's sub-score; the figure is the points it added to the 100-point composite (weight × sub-score).
- Cash flow +17.9/30.0
- ARV discount +15.0/15.0
- DSCR +5.6/10.0
- Appreciation +5.4/10.0
- 1% rule +3.8/10.0
- Livability +2.9/5.0
- Schools +2.7/10.0
- Rent growth +2.5/5.0
- Condition / age +2.5/5.0
$149,900
🖨 Deal sheet 📄 Offer letter ✓ Due diligence
Listing remarks MLS
Welcome to 928 Van Buren, a well-maintained home offering both comfort and opportunity. This property features a functional layout with inviting living spaces, making it a great option for homeowners or investors alike. The home is currently tenant-occupied on a month-to-month lease with tenants paying $1,150 per month. This provides immediate rental income with flexibility for a future owner, whether you choose to continue leasing or occupy the property yourself. Conveniently located near local amenities and Fort Campbell, this property offers strong rental appeal in a desirable area. Whether you're looking to grow your investment portfolio or secure a home with income already in place, 928 Van Buren is a solid opportunity. Need 48 hour notice for all showings
Key facts
- 0.23 acre lot
- Built 1997
- Listed 26 days
Neighborhood map
What this means for you Summary
Snapshot
- This is a 3-bed/1.5-bath single-family listed at $150k.
Deal economics
- At list price, monthly cash flow is $127 ($2k/yr) — positive.
- The deal already cash-flows at list — no discount required.
- To meet the 1% rule (rent ≥ 1% of price), the offer needs to be $132k (12.1% below list).
- Recommended offer: $132k (12.1% below list) — sets the bar for 1% rule.
- Cap rate 7.3% vs local median 3.5% in Oak Grove — top-decile yield for the area; either an underpriced asset or a hidden risk that comps aren't pricing in. Stress-test before assuming the spread holds.
Location & tenants
- Location reads 57/100 on livability (#445 in KY) — a working-class tenant base; expect higher turnover. Strengths: cost of living A+, housing A+; Watch: crime C-, schools F, amenities F.
- Christian County (town): math 30% / reading 34% proficiency, ranked #93 of 165 in KY (top 56%) — families likely to look elsewhere, expect single-tenant / working-renter base with shorter leases; 61% free/reduced lunch — lower-income household profile, screen leases tightly.
- Market conditions: Rents flat; 83 active listings in the ZIP; 193 units permitted in Christian County in 2024 (66 in 5+ unit buildings).
- This rent runs 30% of the median local income ($52k/yr) — at the standard rent-burdened threshold; future hikes will face affordability resistance.
Forward outlook
- In year one you build about $2k of equity ($1k loan paydown + $1k appreciation (0.9% local appreciation)).
- Christian County population projected at -20% by 2050 — secular population decline; favor cash flow + early exit over multi-decade hold.
- At projected returns (0.9% appreciation + 0.0% rent growth), your $42k cash investment doubles in ~10 years — after that, you're playing with house money.
Negotiation context
- It's been on market 26 days — a 2% lower offer ($148k) is reasonable based on typical stale-listing flexibility.
- 9 sale attempts since 13y ago; this cycle's ask has dropped $15k (9%) from the opening price — seller is motivated, your offer sets the floor, not the list.
- Current owner paid $52k; list at $150k implies a 188% gain — meaningful room to come down on a strong offer.
Risks & watch-outs
- Climate carrying-cost: extreme-heat days projected 7→20/yr by 2055 (HVAC capex compounding) — expect insurance premiums to compound above CPI over the hold.
Questions for the listing agent
- Is there a deadline driving the sale (1031 exchange, divorce, estate, relocation)? That informs how much negotiation room exists.
- Schools are F-rated, which usually means shorter tenancies and higher turnover. Who's the typical renter profile here, and what's been the actual vacancy rate?
- What's the average days-on-market for RENTAL listings here right now (not sales)? A rising rental-DOM trend means longer vacancies and softer asking-rent achievability than the comps imply.
- What's the recent tenant-quality profile in this submarket — average credit score on applications, eviction rate, late-payment / NSF rate, and stable-employment percentage? A property-management company in the area should have these aggregated.
- How much new for-sale + rental construction is in the pipeline within 1–3 miles? Heavy new supply typically softens prices + rents 12–24 months out; constrained supply supports both.
Investment metrics
- 1% rule
- 0.88% ✗
- Cap rate
- 7.31%
- Cash-on-cash
- 3.64%
- DSCR
- 1.16
- GRM
- 9.5
CMA / ARV
- ARV (median comp)
- $187,868
- List price
- $149,900
- Delta
- -20.21%
- Verdict
- UNDERPRICED
- Comps
- 20 within 1.0 mi
Show comp detail 4 sales within ~0.75 mi
| Address | Dist | Beds/Ba | Sqft | Sold | Price | $/sf | Match |
|---|---|---|---|---|---|---|---|
| 129 Gail St | 0.31mi | 2/1.0 (-1) | 796 (+11%) | 6mo | $137,000 | $172 | 56 |
| 122 Gail St | 0.31mi | 2/1.0 (-1) | 750 (+4%) | 20mo | $160,000 | $213 | 55 |
| 319 Atlantic Ave | 0.09mi | 2/1.0 (-1) | 800 (+11%) | 23mo | $170,000 | $213 | 51 |
| 118 Gail St | 0.33mi | 2/1.0 (-1) | 820 (+14%) | 13mo | $75,000 | $91 | 44 |
Match score weights: distance 35% · size 25% · config 20% · recency 20%. Top-matched comps best support the ARV.
Projected returns pro-forma
0.88% appreciation · 0.03% rent growth · sell at horizon
- IRR
- 3.0%
- Equity multiple
- 1.15×
- Total profit
- $6,135
- Equity at exit
- $50,229
- IRR
- 5.9%
- Equity multiple
- 1.66×
- Total profit
- $27,819
- Equity at exit
- $66,026
Cash invested: $41,972 (down + closing). Projections, not guarantees.
Landlord ↔ Tenant lean methodology
- Overall (STATE)
- 83 Strongly Landlord-Friendly
- State Kentucky
- 83 Strongly Landlord-Friendly · R+16
- County
- — inherits STATE
- City
- — inherits STATE
ZIP-level market 42262
- Home prices YoY
- 0.3%
- Rents YoY
- 0.0%
- Active inventory
- 83
- Price-to-rent
- 9.5×
Monthly cashflow live
- Estimated rent
- $1,318 medium interval (Pro) →
- Mortgage (P&I)
- −$786
- Tax from tax record
- −$65 /mo · $786/yr
- Insurance
- −$62
- HOA
- −$0
- Vacancy / Maint / Mgmt
- −$277
- Net cashflow
- $127
Break-even live
UW: 25.0% down · 7.5% · 30yr · 1.5% tax · 5.0% vac · 8.0% maint · 8.0% mgmt
Financing live
Cash to close
- Down payment
- $37,475
- Closing costs
- $4,497
- Reserves months
- —
- Total cash needed
- —
Loan-product check · same deal, 3 products live
Conventional
25% down · 7.5% · 30yr
- Down + closing
- —
- Monthly P&I
- —
- Monthly cashflow
- —
- DSCR
- —
- Eligible?
- —
Personal DTI + credit; lowest rate.
DSCR
20% down · 8.5% · 30yr
- Down + closing
- —
- Monthly P&I
- —
- Monthly cashflow
- —
- DSCR
- —
- Eligible?
- —
No personal income docs; deal must DSCR.
Hard money
10% down · 12.0% · 12mo
- Down + closing
- —
- Monthly P&I
- —
- Monthly cashflow
- —
- DSCR
- —
- Eligible?
- —
Short-term bridge; refi at stabilization.
Listing history 24 events
-
2026-06-08status $149,900 Pending 26 DOM
-
2026-06-07pricedays on market $149,900 Active 26 DOM
-
2026-06-02days on market $159,900 Active 21 DOM
-
2026-06-01days on market $159,900 Active 20 DOM
-
2026-05-31days on market $159,900 Active 19 DOM
-
2026-05-30days on market $159,900 Active 18 DOM
-
2026-05-15status Active 772-char remark
Show marketing remark (772 chars)
Welcome to 928 Van Buren, a well-maintained home offering both comfort and opportunity. This property features a functional layout with inviting living spaces, making it a great option for homeowners or investors alike. The home is currently tenant-occupied on a month-to-month lease with tenants paying $1,150 per month. This provides immediate rental income with flexibility for a future owner, whether you choose to continue leasing or occupy the property yourself. Conveniently located near local amenities and Fort Campbell, this property offers strong rental appeal in a desirable area. Whether you're looking to grow your investment portfolio or secure a home with income already in place, 928 Van Buren is a solid opportunity. Need 48 hour notice for all showings
-
2026-02-24$164,900 Active 772-char remark
Show marketing remark (772 chars)
Welcome to 928 Van Buren, a well-maintained home offering both comfort and opportunity. This property features a functional layout with inviting living spaces, making it a great option for homeowners or investors alike. The home is currently tenant-occupied on a month-to-month lease with tenants paying $1,150 per month. This provides immediate rental income with flexibility for a future owner, whether you choose to continue leasing or occupy the property yourself. Conveniently located near local amenities and Fort Campbell, this property offers strong rental appeal in a desirable area. Whether you're looking to grow your investment portfolio or secure a home with income already in place, 928 Van Buren is a solid opportunity. Need 48 hour notice for all showings
-
2024-04-27historical $1,150
-
2024-04-12$1,150
-
2024-04-12price $1,150
-
2024-04-10historical $1,150
-
2024-04-02$1,150
-
2016-09-22soldstatus $52,000 93-char remark
Show marketing remark (93 chars)
This home is in move-in condition. New carpet, freshly painted, deck, fenced yard. Great Buy!
-
2016-09-22soldstatus $52,000
Show marketing remark (93 chars)
This home is in move-in condition. New carpet, freshly painted, deck, fenced yard. Great Buy!
-
2016-09-20soldstatus $52,000
-
2016-04-19$59,000
Show marketing remark (93 chars)
This home is in move-in condition. New carpet, freshly painted, deck, fenced yard. Great Buy!
-
2016-04-19$59,000 93-char remark
Show marketing remark (93 chars)
This home is in move-in condition. New carpet, freshly painted, deck, fenced yard. Great Buy!
-
2016-04-01historical
-
2015-02-05$61,000
-
2015-01-29historical
-
2014-08-04$67,500
-
2014-07-26historical
-
2013-07-25$69,500
ⓘ Source: listings_history table (triggers on properties + properties_extension) + one-shot
backfill from property_details.listing_events for pre-trigger history.
Tax reassessment forecast KY · Resets to sale price
- Current annual tax
- $786 · $65/mo
- Projected year-2 tax
- $1,289 · $107/mo
- Expected delta
- +$503/yr (+$42/mo · 64.0%)
ⓘ Screening estimate from a state-policy table — verify with the county assessor before closing.
Climate risk First Street
- Flood 1/10 Low FEMA zone X (unshaded) · 0% chance over 30 yrs
- Wildfire 1/10 Low
- Heat 5/10 Major 7 d/yr ≥107°F today · 20 d/yr by 30 yrs out
- Wind 4/10 Moderate 10% chance of damaging wind over 30 yrs
- Air quality 2/10 Low 1 unhealthy d/yr today · 2 by 30 yrs out
Nearby sold comps map
Loading sold comps map…
Walkable amenities ~0.75 mi
Loading nearby amenities…
Taxation est. · year 1
- Rental income
- $15,816
- − Mortgage interest
- −$8,397
- − Property taxes
- −$786
- − Insurance
- −$750
- − Repairs & maintenance
- −$1,265
- − Management
- −$1,265
- − Depreciation
- −$4,361
- Taxable loss
- −$1,008
- Est. tax savings @ 24.0%
- +$242
- After-tax cash flow
- $1,768/yr
For passive investors: Depreciation is non-cash, so a rental often shows a tax loss while cash-flowing — sheltering income. Rental losses are passive: they offset passive income freely, and up to $25,000/yr can offset ordinary (W-2) income if you actively participate and your MAGI is under $100k (phasing out to $0 by $150k); unused losses carry forward. On sale, claimed depreciation is recaptured at up to 25%, and gains may owe capital-gains tax (a 1031 exchange can defer both). Figures are a year-1 estimate at your 24.0% rate — not tax advice; consult a CPA.
Schools (NCES district)
- District
- Christian County
- NCES district ID
- 2101150
- Math proficiency
- 30% ▼ -9.00%
- Reading proficiency
- 34% ▼ -10.00%
- Median HH income
- $38,961
- Composite
- 26.8/100
- National rank
- #7118
- State rank
- #93 of 165 in KY
Livability — Oak Grove
- Score
- 57/100
- State rank
- #445
- US rank
- #21938
Category grades
Schools grade is shown separately in the Schools card above.
Census & demographics
- Census place
- Oak Grove, KY
- County
- Christian County · 51,080 people
- City population
- 9,665
- Metro
- Clarksville, TN-KY
- Population (ZIP)
- 9,665
- Household income
- $51,975
- Rent vs Own
- Severe rent burden
- 485.0
Population outlook (Christian County) Hauer SSP2
- Today (2025)
- 67,861 people
- By 2030
- 65,808 · -3.0%
- By 2040
- 60,090 · -11.5%
- By 2050
- 54,561 · -19.6%
- By 2075
- 45,859 · -32.4%
- By 2100
- 38,310 · -43.5%
Race, ethnicity, and origin ACS 2023
- Neighborhood character
- Diverse neighborhood (Simpson 0.58)
- Race & ethnicity
- White 61% Black 19% Two or more races 15% Hispanic / Latino 12% Asian 2%
- Hispanic origin (detail)
- Mexican 8% Puerto Rican 3%
- Common ancestry
- Italian 4% Polish 4% Lithuanian 1%
- Foreign-born
- 3% · Canada
- Languages at home
- 84% English-only · German/W. Germanic 10% Spanish 4% Other Asian/Pacific 1%
Political lean MEDSL · Christian
- 2024 margin
- Solid R (+33.6) · D 32.6% · R 66.1% · Other 1.3%
- 2008→2024 swing
- -12.4pp toward R · 2008: -21.2pp · 2024: -33.6pp
- All cycles
- 2024: R+33.6 2020: R+28.4 2016: R+31.4 2012: R+23.8 2008: R+21.2
Not yet ingested
- Civics
- —
Market trends
- HPI YoY
- ▲ 0.88%
- Current HPI
- 264.8628
- Rent YoY
- ▬ 0.03%
- Metro
- Clarksville, TN-KY
- State GDP YoY
- ▲ 1.81%
- F500 in state
- 4
Industry mix (Fortune 500 HQ in KY)
| Industry | F500 HQs | Revenue |
|---|---|---|
| Healthcare | 1 | $118B |
|
||
| Food / Beverage | 1 | $7B |
|
||
Price history
+137.3% since first listed18 events — show timeline
- 2026-05-15 Relisted — REALTRACS as Distributed by MLS Grid
- 2026-02-24 Listed $164,900 REALTRACS as Distributed by MLS Grid
- 2024-04-27 Rental Removed $1,150 REALTRACS
- 2024-04-12 Listed for Rent $1,150 REALTRACS
- 2024-04-12 Price Changed $1,150 APPFOLIO
- 2024-04-10 Rental Removed $1,150 APPFOLIO
- 2024-04-02 Listed for Rent $1,150 APPFOLIO
- 2016-09-22 Sold (Public Records) $52,000 Public Records
- 2016-09-22 Sold (MLS) $52,000 REALTRACS as Distributed by MLS Grid
- 2016-09-20 Sold (MLS) $52,000 HCTCBOR
- 2016-04-19 Listed $59,000 HCTCBOR
- 2016-04-19 Listed $59,000 REALTRACS as Distributed by MLS Grid
- 2016-04-01 Listing Removed — REALTRACS as Distributed by MLS Grid
- 2015-02-05 Listed $61,000 REALTRACS as Distributed by MLS Grid
- 2015-01-29 Listing Removed — REALTRACS as Distributed by MLS Grid
- 2014-08-04 Listed $67,500 REALTRACS as Distributed by MLS Grid
- 2014-07-26 Listing Removed — REALTRACS as Distributed by MLS Grid
- 2013-07-25 Listed $69,500 REALTRACS as Distributed by MLS Grid
Property tax history
+2.7%/yrLatest (2025): $786 · -3.8% YoY. Source: county tax records.
Cash-flow waterfall
monthlySold comps — $/sqft
last 12 mo · ≤1 miLoading sold comps…