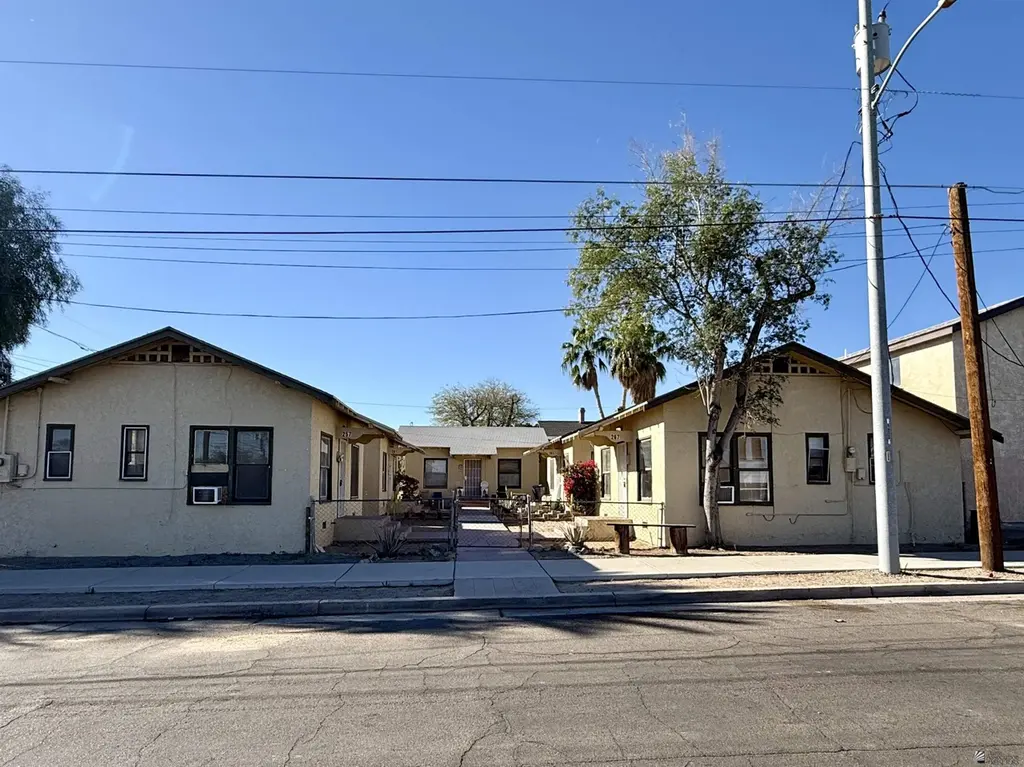
257-267 W 5 St Unit 285 W 5th St
Yuma, AZ 85364
$794,900B-
66 bd · 66.0 ba ·
— sqft ·
Built —
· MultiFamily
· Active
· 96 DOM
Cashflow @ list (25.0% down · 7.5%)
Estimated rent
$12,454/mo
Mortgage (P&I)
−$4,169
Tax + insurance
−$1,325
HOA
−$0
Vac / Maint / Mgmt
−$2,615
Net cashflow
$4,345/mo
Annual
$52,143/yr
Cap rate
12.85%
Cash-on-cash
23.43%
DSCR
2.04
1% rule
1.57%
Cash to close
$222,572
Investor read
- This is a 6 × 11-bed/?-bath units multifamily listed at $795k. Condition is rated fair.
- At list price, monthly cash flow is $4k ($52k/yr) — positive. Per door: $724/mo.
- The deal already cash-flows at list — no discount required.
- Meets the 1% rule at list price ($12k rent vs $795k).
- It's been on market 96 days — a 9% lower offer ($723k) is reasonable based on typical stale-listing flexibility.
- Recommended offer: $723k (9.0% below list) — sets the bar for market timing.
- Local home prices are declining (-3.0%/yr); year-one equity from $5k of loan paydown is wiped out by about $24k of value loss. Plan a longer hold.
- Location reads 71/100 on livability (#30 in AZ) — a middle-class / working-renter tenant base. Strengths: cost of living A+, housing A+, health & safety A+; Watch: schools C-, crime C-, employment D.
- Yuma Union High School District (4507) (urban): math 14% / reading 16% proficiency, ranked #212 of 249 in AZ (top 85%) — low school quality limits family demand, transient renter base, plan for 1-2y turnover.
- Market conditions: Rents rising (+2.0%/yr); 264 active listings in the ZIP; 1,399 units permitted in Yuma County in 2024 (180 in 5+ unit buildings).
- Yuma County population projected at +4% by 2050 — modest demand growth; plan on rents tracking national, not racing it.
- At projected returns (-3.0% appreciation + 2.0% rent growth), your $223k cash investment doubles in ~6 years — after that, you're playing with house money.
- Climate carrying-cost: extreme-heat days projected 7→20/yr by 2055 (HVAC capex compounding) — expect insurance premiums to compound above CPI over the hold.
- Cap rate 12.9% vs local median 3.9% in Yuma — top-decile yield for the area; either an underpriced asset or a hidden risk that comps aren't pricing in. Stress-test before assuming the spread holds.
- At $12,454/mo this rent would consume 258% of the median local household income ($58k/yr) (locally 2195% of renters already pay >50% of income on rent) — very limited rent-growth headroom before tenants either downsize or default.
Questions for listing agent
- It's been on market 96 days. Have you received any prior offers? Is the seller open to a 9% concession, seller financing, or rate buy-down credit?
- Can we see the unit-by-unit rent roll, current vacancy, and any below-market leases? What's the average tenancy length?
- What capital expenditures (roof, boiler, parking lot, exteriors) have been made in the last 5 years, and what's planned in the next 2?
- Have any recent inspections been done? Can we get a copy of the seller's disclosures and any deferred-maintenance estimates?
- Why hasn't it sold? Are there any deal-killer items the seller is aware of (foundation, flood, title, zoning, code violations)?
- Is there a deadline driving the sale (1031 exchange, divorce, estate, relocation)? That informs how much negotiation room exists.
- What's the average days-on-market for RENTAL listings here right now (not sales)? A rising rental-DOM trend means longer vacancies and softer asking-rent achievability than the comps imply.
- What's the recent tenant-quality profile in this submarket — average credit score on applications, eviction rate, late-payment / NSF rate, and stable-employment percentage? A property-management company in the area should have these aggregated.
Repairs flagged (vision-AI assessment)
- Moderate: Exterior walls — Visible discoloration and wear.
- Minor: Landscaping — Minimal and in need of some maintenance.
CashFlowRE · CFR-YKG71R09NDB1TZ
· Data 5 h ago
cashflowre.app · 2026-05-29