 6-Plex
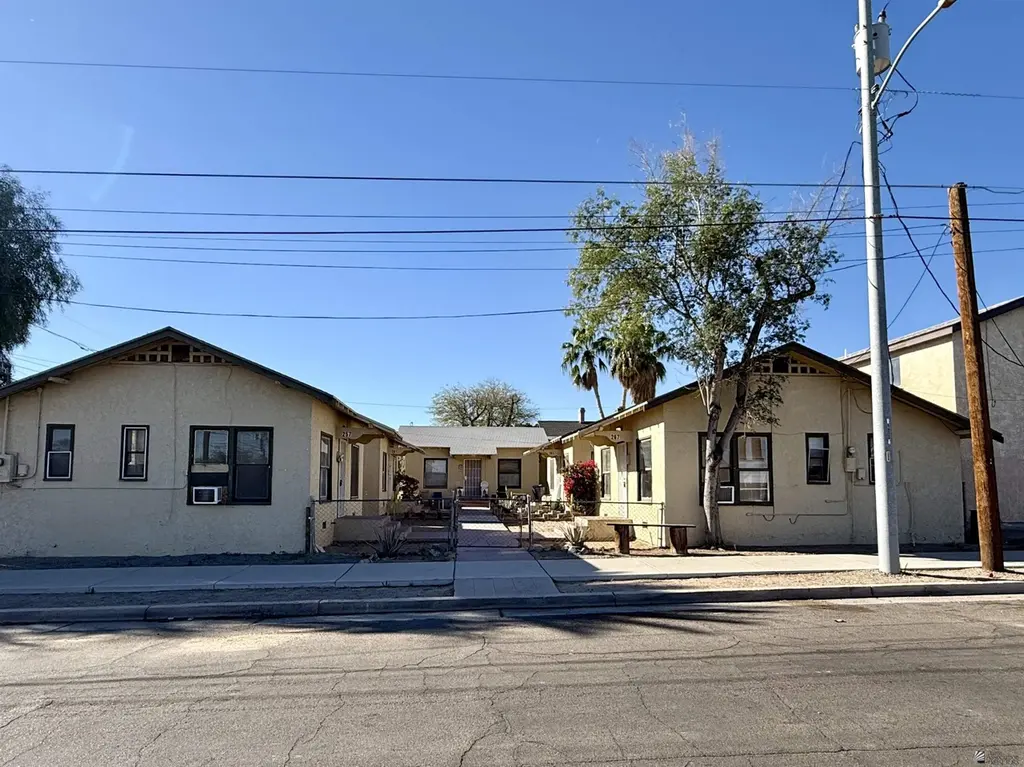
257-267 W 5 St Unit 285 W 5th St · Yuma, AZ
Flood risk 1/10 · Minimal
- FEMA flood zone
- X (shaded)
- Chance of flooding over 30 yrs
- 0.0%
- Est. flood insurance / yr
- $507 – $1,088
Fire risk 1/10 · Minimal
- Est. fire insurance / yr
- $610 – $1,132
Heat risk 9/10 · Severe
- Hot days now (above 114°F)
- 7 days/yr
- Hot days in 30 yrs
- 20 days/yr
Wind risk 1/10 · Minimal
- Chance of severe wind over 30 yrs
- —
Air-quality risk 2/10 · Minimal
- Unhealthy air days now
- 2 days/yr
- Unhealthy air days in 30 yrs
- 2 days/yr
Risk factors via First Street. Map © Google.
Why this score? — see what drove the B- grade
The composite is a weighted blend of 9 inputs, each scored 0–100. Each bar is that input's sub-score; the figure is the points it added to the 100-point composite (weight × sub-score).
- Cash flow +30.0/30.0
- 1% rule +10.0/10.0
- DSCR +10.0/10.0
- ARV discount +7.5/15.0
- Livability +3.6/5.0
- Rent growth +3.0/5.0
- Condition / age +2.2/5.0
- Schools +1.3/10.0
- Appreciation +0.0/10.0
$794,900
🖨 Deal sheet (PDF) 📄 Offer letter ✓ Due diligence
Multi-family units
County records classify this as Multi-Family (5+ Unit). Listing-text estimate: 6 units. confirmed
5+ unit building — per-unit beds/baths from public records are typically unavailable; the breakdown below (if shown) is an estimate from the listing text.
Listing remarks
Rare North End investment opportunity! This unique 8-unit property features a two-story triplex plus five charming cottages arranged in a courtyard-style setting. Each cottage includes 2 bedrooms, 1 bathroom, a living room, and a kitchen. The triplex offers two 2-bedroom, 2-bath units and one 1-bedroom, 1-bath unit. All units are separately metered for electricity. Triplex roof replaced in 2025.
Key facts
- Two story triplex
- Listed 93 days
Tags
Property features AI
Exterior
- Parking: On-street parking; Open parking available
- Utilities: Public water; Electric service on property
- Home design: Residential income property; Multi-family (2–8 plexes)
- Exterior features: Paved road access
Interior
- Kitchen: Refrigerator; Range
- Heating & cooling: Has cooling; Has heating
- Interior features: Cooling included; Heating included
Neighborhood map
What this means for you Summary
Snapshot
- This is a 6 × 11-bed/?-bath units multifamily listed at $795k. Condition is rated fair.
Deal economics
- At list price, monthly cash flow is $4k ($52k/yr) — positive. Per door: $724/mo.
- The deal already cash-flows at list — no discount required.
- Meets the 1% rule at list price ($12k rent vs $795k).
- Recommended offer: $723k (9.0% below list) — sets the bar for market timing.
- Cap rate 12.9% vs local median 3.9% in Yuma — top-decile yield for the area; either an underpriced asset or a hidden risk that comps aren't pricing in. Stress-test before assuming the spread holds.
Location & tenants
- Location reads 71/100 on livability (#30 in AZ) — a middle-class / working-renter tenant base. Strengths: cost of living A+, housing A+, health & safety A+; Watch: schools C-, crime C-, employment D.
- Yuma Union High School District (4507) (urban): math 14% / reading 16% proficiency, ranked #212 of 249 in AZ (top 85%) — low school quality limits family demand, transient renter base, plan for 1-2y turnover.
- Market conditions: Rents rising (+2.0%/yr); 262 active listings in the ZIP; 1,399 units permitted in Yuma County in 2024 (180 in 5+ unit buildings).
- At $12,454/mo this rent would consume 258% of the median local household income ($58k/yr) (locally 2195% of renters already pay >50% of income on rent) — very limited rent-growth headroom before tenants either downsize or default.
Forward outlook
- Local home prices are declining (-3.0%/yr); year-one equity from $5k of loan paydown is wiped out by about $24k of value loss. Plan a longer hold.
- Yuma County population projected at +4% by 2050 — modest demand growth; plan on rents tracking national, not racing it.
- At projected returns (-3.0% appreciation + 2.0% rent growth), your $223k cash investment doubles in ~6 years — after that, you're playing with house money.
Negotiation context
- It's been on market 94 days — a 9% lower offer ($723k) is reasonable based on typical stale-listing flexibility.
Risks & watch-outs
- Climate carrying-cost: extreme-heat days projected 7→20/yr by 2055 (HVAC capex compounding) — expect insurance premiums to compound above CPI over the hold.
Questions for the listing agent
- It's been on market 94 days. Have you received any prior offers? Is the seller open to a 9% concession, seller financing, or rate buy-down credit?
- Can we see the unit-by-unit rent roll, current vacancy, and any below-market leases? What's the average tenancy length?
- What capital expenditures (roof, boiler, parking lot, exteriors) have been made in the last 5 years, and what's planned in the next 2?
- Have any recent inspections been done? Can we get a copy of the seller's disclosures and any deferred-maintenance estimates?
- Why hasn't it sold? Are there any deal-killer items the seller is aware of (foundation, flood, title, zoning, code violations)?
- Is there a deadline driving the sale (1031 exchange, divorce, estate, relocation)? That informs how much negotiation room exists.
- What's the average days-on-market for RENTAL listings here right now (not sales)? A rising rental-DOM trend means longer vacancies and softer asking-rent achievability than the comps imply.
- What's the recent tenant-quality profile in this submarket — average credit score on applications, eviction rate, late-payment / NSF rate, and stable-employment percentage? A property-management company in the area should have these aggregated.
- How much new apartment / multifamily construction is in the pipeline within 1–3 miles? Heavy new supply (>2% of stock underway) typically softens rents 12–24 months out; light construction supports rent growth.
Investment metrics
- 1% rule
- 1.57% ✓
- Cap rate
- 12.85%
- Cash-on-cash
- 23.43%
- DSCR
- 2.04
- GRM
- 5.3
CMA / ARV
No comps found within radius.
Projected returns pro-forma
-3.0% appreciation · 2.04% rent growth · sell at horizon
- IRR
- 15.4%
- Equity multiple
- 1.61×
- Total profit
- $136,217
- Equity at exit
- $118,522
- IRR
- 23.4%
- Equity multiple
- 2.92×
- Total profit
- $427,783
- Equity at exit
- $68,728
Cash invested: $222,572 (down + closing). Projections, not guarantees.
Landlord ↔ Tenant lean methodology
- Overall (STATE)
- 87 Strongly Landlord-Friendly
- State Arizona
- 87 Strongly Landlord-Friendly · R+3
- County
- — inherits STATE
- City
- — inherits STATE
ZIP-level market 85364
- Rents YoY
- 2.0%
- Active inventory
- 262
- Price-to-rent
- 31.9×
Monthly cashflow live
- Estimated rent
- $12,454 medium interval (Pro) →
- Mortgage (P&I)
- −$4,169
- Tax est. 1.5%
- −$994 /mo · $11,924/yr
- Insurance
- −$331
- HOA
- −$0
- Vacancy / Maint / Mgmt
- −$2,615
- Net cashflow
- $4,345
Break-even live
Sensitivity live
| Price | -10% $4,895 | -5% $4,620 | +0% $4,345 | +5% $4,071 | +10% $3,796 |
|---|---|---|---|---|---|
| Rent | -10% $3,361 | -5% $3,853 | +0% $4,345 | +5% $4,837 | +10% $5,329 |
| Rate | -1.0pp $4,746 | -0.5pp $4,547 | base $4,345 | +0.5pp $4,139 | +1.0pp $3,930 |
6-unit breakdown (identical units grouped — click to expand)
| Units | Beds | Baths | Est. rent |
|---|---|---|---|
| 6× units | 11 | — | $12,456 |
| #1 | 11 | — | $2,076 |
| #2 | 11 | — | $2,076 |
| #3 | 11 | — | $2,076 |
| #4 | 11 | — | $2,076 |
| #5 | 11 | — | $2,076 |
| #6 | 11 | — | $2,076 |
| Total (6 units) | $12,454 | ||
UW: 25.0% down · 7.5% · 30yr · 1.5% tax · 5.0% vac · 8.0% maint · 8.0% mgmt
Financing live
Cash to close
- Down payment
- $198,725
- Closing costs
- $23,847
- Reserves months
- —
- Total cash needed
- —
Loan-product check · same deal, 3 products live
Conventional
25% down · 7.5% · 30yr
- Down + closing
- —
- Monthly P&I
- —
- Monthly cashflow
- —
- DSCR
- —
- Eligible?
- —
Personal DTI + credit; lowest rate.
DSCR
20% down · 8.5% · 30yr
- Down + closing
- —
- Monthly P&I
- —
- Monthly cashflow
- —
- DSCR
- —
- Eligible?
- —
No personal income docs; deal must DSCR.
Hard money
10% down · 12.0% · 12mo
- Down + closing
- —
- Monthly P&I
- —
- Monthly cashflow
- —
- DSCR
- —
- Eligible?
- —
Short-term bridge; refi at stabilization.
Listing history 17 events
-
2026-06-19days on market $794,900 Active 94 DOM
-
2026-06-18days on market $794,900 Active 93 DOM
-
2026-06-17days on market $794,900 Active 92 DOM
-
2026-06-16days on market $794,900 Active 91 DOM
-
2026-06-15days on market $794,900 Active 90 DOM
-
2026-06-14days on market $794,900 Active 88 DOM
-
2026-06-13days on market $794,900 Active 87 DOM
-
2026-06-10days on market $794,900 Active 85 DOM
-
2026-06-09days on market $794,900 Active 84 DOM
-
2026-06-08days on market $794,900 Active 83 DOM
-
2026-06-07days on market $794,900 Active 82 DOM
-
2026-06-05days on market $794,900 Active 79 DOM
-
2026-06-02days on market $794,900 Active 77 DOM
-
2026-06-01days on market $794,900 Active 76 DOM
-
2026-05-31days on market $794,900 Active 75 DOM
-
2026-05-30days on market $794,900 Active 74 DOM
-
2026-03-17$794,900 Active
ⓘ Source: listings_history table (triggers on properties + properties_extension) + one-shot
backfill from property_details.listing_events for pre-trigger history.
Climate risk First Street
- Flood 1/10 Low FEMA zone X (shaded) · 0% chance over 30 yrs
- Wildfire 1/10 Low
- Heat 9/10 Extreme 7 d/yr ≥114°F today · 20 d/yr by 30 yrs out
- Wind 1/10 Low
- Air quality 2/10 Low 2 unhealthy d/yr today · 2 by 30 yrs out
Nearby sold comps map
Loading sold comps map…
Walkable amenities ~0.75 mi
Loading nearby amenities…
Taxation est. · year 1
- Rental income
- $149,448
- − Mortgage interest
- −$44,527
- − Property taxes
- −$11,924
- − Insurance
- −$3,974
- − Repairs & maintenance
- −$11,956
- − Management
- −$11,956
- − Depreciation
- −$23,124
- Taxable income
- $41,987
- Est. tax owed @ 24.0%
- −$10,077
- After-tax cash flow
- $42,066/yr
For passive investors: Depreciation is non-cash, so a rental often shows a tax loss while cash-flowing — sheltering income. Rental losses are passive: they offset passive income freely, and up to $25,000/yr can offset ordinary (W-2) income if you actively participate and your MAGI is under $100k (phasing out to $0 by $150k); unused losses carry forward. On sale, claimed depreciation is recaptured at up to 25%, and gains may owe capital-gains tax (a 1031 exchange can defer both). Figures are a year-1 estimate at your 24.0% rate — not tax advice; consult a CPA.
Condition & rehab AI · 13 photos
This multi-family property requires moderate repairs and maintenance to improve its condition and increase its value.
Repairs flagged
- Moderate Exterior walls — Visible discoloration and wear.
- Minor Landscaping — Minimal and in need of some maintenance.
Value-add opportunities
- Both Paint exterior walls — Improves curb appeal and overall condition.
- Both Landscaping — Enhances curb appeal and adds value to the property.
Renovation cost estimate screening
| Repair item | Severity | Est. cost |
|---|---|---|
| Exterior walls · Visible discoloration and wear. | Moderate | $3,000–15,000 |
| Landscaping · Minimal and in need of some maintenance. | Minor | $500–3,000 |
| Total estimated repair cost · 2 items | $3,500–18,000 |
Value-add ROI direction
- Both Paint exterior walls — Improves curb appeal and overall condition. ↑
- Both Landscaping — Enhances curb appeal and adds value to the property. ↑
ⓘ Cost ranges are severity-bucket heuristics (US national rule-of-thumb). Get contractor quotes + a written scope before underwriting a rehab budget.
Schools (NCES district)
- District
- Yuma Union High School District (4507)
- NCES district ID
- 0409630
- Math proficiency
- 14% ▼ -12.00%
- Reading proficiency
- 16% ▼ -10.00%
- Median HH income
- $40,512
- Composite
- 12.86/100
- National rank
- #9592
- State rank
- #212 of 249 in AZ
Livability — Yuma
- Score
- 71/100
- State rank
- #30
- US rank
- #6635
Category grades
Schools grade is shown separately in the Schools card above.
Census & demographics
- Census place
- Yuma, AZ
- County
- Yuma County · 149,809 people
- City population
- 149,809
- Metro
- Yuma, AZ
- Population (ZIP)
- 72,960
- Household income
- $57,874
- Rent vs Own
- Severe rent burden
- 2195.0
Population outlook (Yuma County) Hauer SSP2
- Today (2025)
- 211,633 people
- By 2030
- 214,114 · +1.2%
- By 2040
- 217,856 · +2.9%
- By 2050
- 220,276 · +4.1%
- By 2075
- 222,359 · +5.1%
- By 2100
- 198,880 · -6.0%
Race, ethnicity, and origin ACS 2023
- Neighborhood character
- Predominantly Hispanic (70%)
- Race & ethnicity
- Hispanic / Latino 70% Two or more races 29% White 24% Asian 2% Black 2% Native American 1%
- Hispanic origin (detail)
- Mexican 67%
- Common ancestry
- Portuguese 1% Lithuanian 1% Romanian 1%
- Foreign-born
- 22% · Canada
- Languages at home
- 48% English-only · Spanish 50% Tagalog/Filipino 1%
Political lean MEDSL · Yuma
- 2024 margin
- Strong R (+20.4) · D 39.3% · R 59.8%
- 2008→2024 swing
- -6.6pp toward R · 2008: -13.8pp · 2024: -20.4pp
- All cycles
- 2024: R+20.4 2020: R+6.2 2016: R+5.5 2012: R+16.1 2008: R+13.8
Not yet ingested
- Civics
- —
Market trends
- HPI YoY
- ▼ -197.00%
- Current HPI
- 220.8058
- Rent YoY
- ▲ 2.04%
- Metro
- Yuma, AZ
- State GDP YoY
- ▲ 4.54%
- F500 in state
- 20
Industry mix (Fortune 500 HQ in AZ)
| Industry | F500 HQs | Revenue |
|---|---|---|
| Technology | 2 | $13B |
|
||
| Mining / Metals | 1 | $23B |
|
||
| Environmental Services | 1 | $16B |
|
||
| Metals / Steel | 1 | $14B |
|
||
| Technology Distribution | 1 | $9B |
|
||
| Homebuilding | 1 | $8B |
|
||
Price history
1 event — show timeline
- 2026-03-17 Listed $794,900 YAR
Cash-flow waterfall
monthlySold comps — $/sqft
last 12 mo · ≤1 miLoading sold comps…