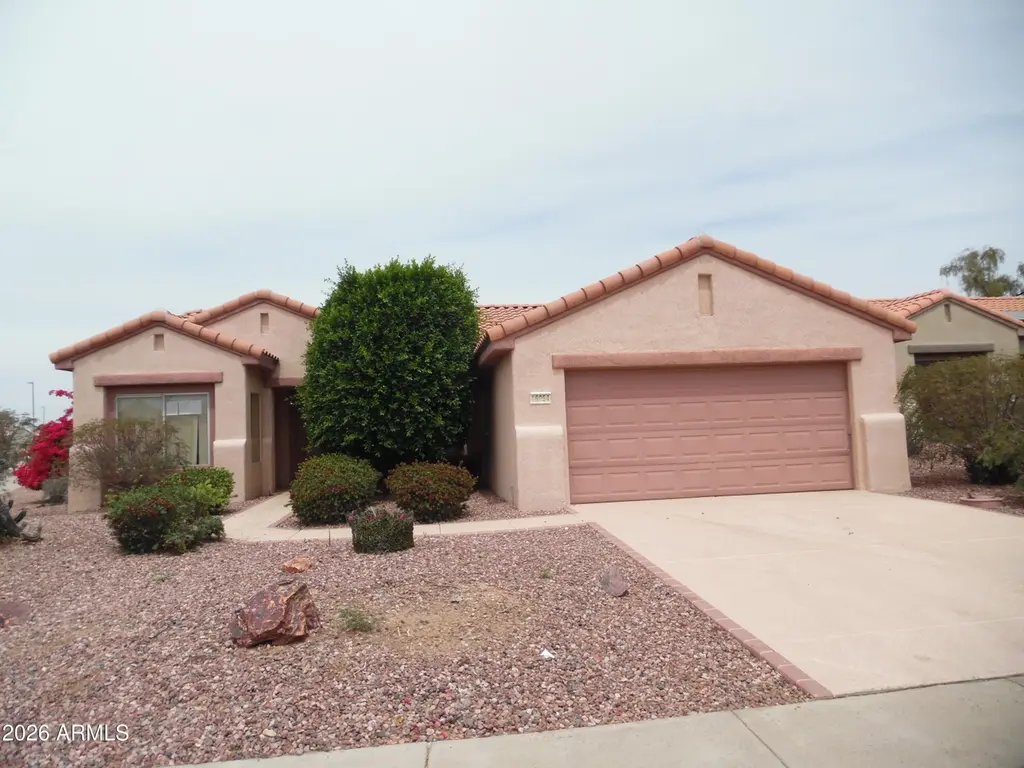
16054 W Rio Verde Ct
Surprise, AZ 85374
$300,000D-
2 bd · 2.0 ba ·
1,627 sqft ·
Built 1999
· SingleFamily
· Pending
· 24 DOM
Cashflow @ list (25.0% down · 7.5%)
Estimated rent
$2,164/mo
Mortgage (P&I)
−$1,573
Tax + insurance
−$294
HOA
−$160
Vac / Maint / Mgmt
−$454
Net cashflow
$-318/mo
Annual
$-3,811/yr
Cap rate
5.02%
Cash-on-cash
-4.54%
DSCR
0.80
1% rule
0.72%
Cash to close
$84,000
Investor read
- This is a 2-bed/2.0-bath single-family listed at $300k.
- At list price, monthly cash flow is $-318 ($-4k/yr) — negative.
- To cash-flow at today's rent, offer at most $244k (18.7% below list).
- To meet the 1% rule (rent ≥ 1% of price), the offer needs to be $216k (27.9% below list).
- It's been on market 24 days — a 2% lower offer ($296k) is reasonable based on typical stale-listing flexibility.
- Recommended offer: $216k (27.9% below list) — sets the bar for 1% rule.
- Local home prices are declining (-3.0%/yr); year-one equity from $2k of loan paydown is wiped out by about $9k of value loss. Plan a longer hold.
- Location reads 74/100 on livability (#19 in AZ, #4,616 nationally) — a middle-class / working-renter tenant base. Strengths: crime A+, housing A+, employment A-; Watch: health & safety D+, amenities D-, commute F.
- Dysart Unified District (4243) (suburban): math 34% / reading 40% proficiency, ranked #73 of 249 in AZ (top 29%) — families likely to look elsewhere, expect single-tenant / working-renter base with shorter leases.
- Zoned schools: El Mirage Elementary School (math 19% / reading 22%, grade F, #729 of 1,109 statewide, top 67%, 764 students, 80% FRL); Dysart Middle School (math 29% / reading 31%, grade F, #82 of 218 statewide, top 38%, 646 students, 76% FRL); Dysart High School (math 23% / reading 32%, grade F, #139 of 381 statewide, top 36%, 1,433 students, 58% FRL) — zoned schools average 71% FRL vs 41% district-wide (30 pts higher); higher-poverty schools than district average — tighter screening recommended.
- Market conditions: Rents flat; 406 active listings in the ZIP; 40 comparable units currently listed for rent nearby; rentals at typical pace (median 26d on market — plan ~3-4 weeks tenant-placement turnaround); 40% of comp listings sitting > 30 days — soft ceiling on asking rent; solid renter incomes; 36,011 units permitted in Maricopa County in 2024 (12,801 in 5+ unit buildings).
- Maricopa County population projected at +38% by 2050 — long-run rental-demand tailwind backs the buy-and-hold thesis.
- 3 sale attempts since 10y ago with the ask held roughly flat each time — persistent listings suggest the price (not the market) is what's stuck; bring a comps-based counter.
- Climate carrying-cost: extreme-heat days projected 7→17/yr by 2055 (HVAC capex compounding) — expect insurance premiums to compound above CPI over the hold.
- Cap rate 5.0% vs local median 3.3% in Surprise — top-decile yield for the area; either an underpriced asset or a hidden risk that comps aren't pricing in. Stress-test before assuming the spread holds.
- This rent runs 32% of the median local income ($81k/yr) — at the standard rent-burdened threshold; future hikes will face affordability resistance.
Questions for listing agent
- What do current leases actually rent for vs. the listed asking? Can we see a recent rent roll and the last 12 months of T-12 income?
- What does the HOA fee cover, when was the last increase, and are there any pending special assessments or reserve-fund shortfalls?
- Is there a deadline driving the sale (1031 exchange, divorce, estate, relocation)? That informs how much negotiation room exists.
- The area grade is low — what's the realistic commute time and amenity access for the typical tenant pool here? Any planned neighborhood developments (good or bad) we should know about?
- What's the average days-on-market for RENTAL listings here right now (not sales)? A rising rental-DOM trend means longer vacancies and softer asking-rent achievability than the comps imply.
- What's the recent tenant-quality profile in this submarket — average credit score on applications, eviction rate, late-payment / NSF rate, and stable-employment percentage? A property-management company in the area should have these aggregated.
- How much new for-sale + rental construction is in the pipeline within 1–3 miles? Heavy new supply typically softens prices + rents 12–24 months out; constrained supply supports both.
CashFlowRE · CFR-YKKN8RBX7CK6SV
· Data 5 days ago
cashflowre.app · 2026-05-29