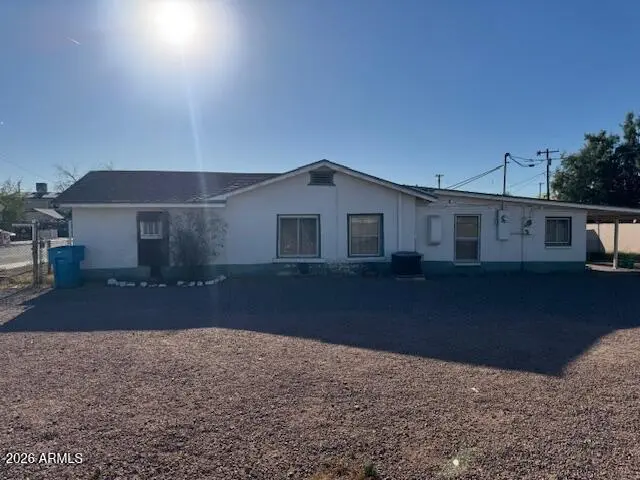
926 W Cocopah St
Phoenix, AZ 85007
$270,000C-
2 bd · 2.0 ba ·
1,512 sqft ·
Built 1940
· SingleFamily
· Active
· 60 DOM
Cashflow @ list (25.0% down · 7.5%)
Estimated rent
$2,205/mo
Mortgage (P&I)
−$1,416
Tax + insurance
−$161
HOA
−$0
Vac / Maint / Mgmt
−$463
Net cashflow
$165/mo
Annual
$1,985/yr
Cap rate
7.03%
Cash-on-cash
2.63%
DSCR
1.12
1% rule
0.82%
Cash to close
$75,600
Investor read
- This is a 2-bed/2.0-bath single-family listed at $270k.
- At list price, monthly cash flow is $165 ($2k/yr) — positive.
- The deal already cash-flows at list — no discount required.
- To meet the 1% rule (rent ≥ 1% of price), the offer needs to be $220k (18.3% below list).
- It's been on market 60 days — a 3% lower offer ($262k) is reasonable based on typical stale-listing flexibility.
- Recommended offer: $220k (18.3% below list) — sets the bar for 1% rule.
- Local home prices are declining (-3.0%/yr); year-one equity from $2k of loan paydown is wiped out by about $8k of value loss. Plan a longer hold.
- Location reads 75/100 on livability (#16 in AZ, #3,924 nationally) — a middle-class / working-renter tenant base. Strengths: amenities A+, commute A+, housing A+; Watch: health & safety C-, crime F.
- Phoenix Union High School District (4286) (urban): math 10% / reading 15% proficiency, ranked #224 of 249 in AZ (top 90%) — low school quality limits family demand, transient renter base, plan for 1-2y turnover.
- Zoned schools: Augustus H. Shaw Montessori (math 42% / reading 57%, grade D, #271 of 1,109 statewide, top 26%, 453 students, 32% FRL); Central High School (math 13% / reading 16%, grade F, #267 of 381 statewide, top 72%, 1,901 students, 92% FRL).
- Zoned-school proficiency averages 32% at this address vs 12% district-wide (+20 pts) — the actual schools serving this property are materially stronger than the Phoenix Union High School District (4286) average implies; a family-tenant draw the district grade alone would hide.
- Watch-outs: built in 1940 — expect roof / HVAC / electrical / plumbing capex.
- Market conditions: Rents rising (+1.4%/yr); 88 active listings in the ZIP; 23 comparable units currently listed for rent nearby; rentals leasing fast (median 0d on market — plan ~1-2 weeks tenant-placement turnaround); 36,011 units permitted in Maricopa County in 2024 (12,801 in 5+ unit buildings).
- Maricopa County population projected at +38% by 2050 — long-run rental-demand tailwind backs the buy-and-hold thesis.
- 3 sale attempts; this cycle's ask has dropped $30k (10%) from the opening price — seller is motivated, your offer sets the floor, not the list.
- Current owner paid $14k; list at $270k implies a 1876% gain — meaningful room to come down on a strong offer.
- Climate carrying-cost: extreme-heat days projected 7→19/yr by 2055 (HVAC capex compounding) — expect insurance premiums to compound above CPI over the hold.
- Cap rate 7.0% vs local median 3.3% in Phoenix — top-decile yield for the area; either an underpriced asset or a hidden risk that comps aren't pricing in. Stress-test before assuming the spread holds.
Questions for listing agent
- It's been on market 60 days. Have you received any prior offers? Is the seller open to a 18% concession, seller financing, or rate buy-down credit?
- Built in 1940 — when were the roof, HVAC, electrical panel, plumbing, and water heater last replaced?
- Is there a deadline driving the sale (1031 exchange, divorce, estate, relocation)? That informs how much negotiation room exists.
- Crime grade is F in this area — have there been break-ins, vandalism, or insurance claims at this property in the last 3 years? What carrier currently insures it and at what premium?
- What's the average days-on-market for RENTAL listings here right now (not sales)? A rising rental-DOM trend means longer vacancies and softer asking-rent achievability than the comps imply.
- What's the recent tenant-quality profile in this submarket — average credit score on applications, eviction rate, late-payment / NSF rate, and stable-employment percentage? A property-management company in the area should have these aggregated.
- How much new for-sale + rental construction is in the pipeline within 1–3 miles? Heavy new supply typically softens prices + rents 12–24 months out; constrained supply supports both.
CashFlowRE · CFR-YM4A433EA29H2D
· Data 1 day ago
cashflowre.app · 2026-05-29