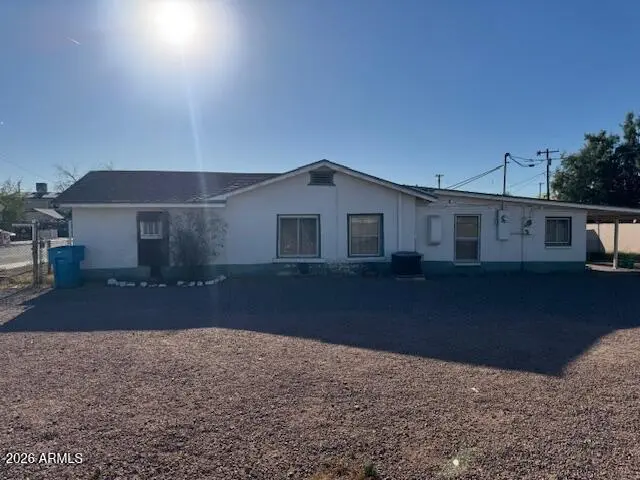
926 W Cocopah St · Phoenix, AZ
Flood risk 1/10 · Minimal
- FEMA flood zone
- X (shaded)
- Chance of flooding over 30 yrs
- 0.0%
- Est. flood insurance / yr
- $507 – $1,088
Fire risk 1/10 · Minimal
- Est. fire insurance / yr
- $610 – $1,132
Heat risk 9/10 · Severe
- Hot days now (above 112°F)
- 7 days/yr
- Hot days in 30 yrs
- 19 days/yr
Wind risk 1/10 · Minimal
- Chance of severe wind over 30 yrs
- —
Air-quality risk 2/10 · Minimal
- Unhealthy air days now
- 2 days/yr
- Unhealthy air days in 30 yrs
- 2 days/yr
Risk factors via First Street. Map © Google.
Why this score? — see what drove the C- grade
The composite is a weighted blend of 9 inputs, each scored 0–100. Each bar is that input's sub-score; the figure is the points it added to the 100-point composite (weight × sub-score).
- Cash flow +16.6/30.0
- ARV discount +15.0/15.0
- DSCR +5.2/10.0
- Livability +3.8/5.0
- 1% rule +3.2/10.0
- Rent growth +2.8/5.0
- Condition / age +2.5/5.0
- Schools +1.1/10.0
- Appreciation +0.0/10.0
$270,000
🖨 Deal sheet (PDF) 📄 Offer letter ✓ Due diligence
Listing remarks
* * BACK ON MARKET THROUGH NO FAULT OF SELLER * * RARE OPPORTUNITY: The listing includes TWO LARGE PARCELS--926 and 922--sold together, providing expanded potential for redevelopment, additional units, or increased value. Investor Special in the heart of Central Phoenix! This distressed fixer-upper offers incredible upside just minutes from downtown, the baseball stadium, Suns arena, Sky Harbor Airport, and major freeway, making it a prime candidate for Airbnb or rental income. Located in a rapidly growing area with strong demand, this property is perfect for investors or flippers ready to bring their vision to life. Endless possibilities in an unbeatable location, don't miss it!
Key facts
- 0.27 acre lot
- 2 garage spots
- Built 1940
Property features AI
Finance
- HOA & community: No association fees
Exterior
- Parking: Detached garage; 2 covered parking spaces; 2 open parking spaces; 2 garage spaces
- Utilities: City water; Public sewer
- Home design: Single family residence; Fee simple ownership; Property listed as fixer
- Construction: Painted block construction; Other roof
- Exterior features: Storage; Shed(s); Chain link fencing
Interior
- Kitchen: Gas stub for range
- Bedrooms: 2 possible bedrooms
- Flooring: Vinyl flooring; Concrete flooring
- Bathrooms: 2 full bathrooms
- Heating & cooling: Has heating (type: Other); Evaporative cooling; Has cooling
- Interior features: Eat-in kitchen; Full bathroom in the master bedroom
- Laundry & utility: Laundry in garage; Washer/dryer hookup only
Neighborhood map
What this means for you Summary
Snapshot
- This is a 2-bed/2.0-bath single-family listed at $270k.
Deal economics
- At list price, monthly cash flow is $165 ($2k/yr) — positive.
- The deal already cash-flows at list — no discount required.
- To meet the 1% rule (rent ≥ 1% of price), the offer needs to be $220k (18.3% below list).
- Recommended offer: $220k (18.3% below list) — sets the bar for 1% rule.
- Cap rate 7.0% vs local median 3.3% in Phoenix — top-decile yield for the area; either an underpriced asset or a hidden risk that comps aren't pricing in. Stress-test before assuming the spread holds.
Location & tenants
- Location reads 75/100 on livability (#16 in AZ, #3,924 nationally) — a middle-class / working-renter tenant base. Strengths: amenities A+, commute A+, housing A+; Watch: health & safety C-, crime F.
- Phoenix Union High School District (4286) (urban): math 10% / reading 15% proficiency, ranked #224 of 249 in AZ (top 90%) — low school quality limits family demand, transient renter base, plan for 1-2y turnover.
- Zoned schools: Augustus H. Shaw Montessori (math 42% / reading 57%, grade D, #271 of 1,109 statewide, top 26%, 453 students, 32% FRL); Central High School (math 13% / reading 16%, grade F, #267 of 381 statewide, top 72%, 1,901 students, 92% FRL).
- Zoned-school proficiency averages 32% at this address vs 12% district-wide (+20 pts) — the actual schools serving this property are materially stronger than the Phoenix Union High School District (4286) average implies; a family-tenant draw the district grade alone would hide.
- Market conditions: Rents rising (+1.4%/yr); 88 active listings in the ZIP; 23 comparable units currently listed for rent nearby; rentals leasing fast (median 0d on market — plan ~1-2 weeks tenant-placement turnaround); 36,011 units permitted in Maricopa County in 2024 (12,801 in 5+ unit buildings).
Forward outlook
- Local home prices are declining (-3.0%/yr); year-one equity from $2k of loan paydown is wiped out by about $8k of value loss. Plan a longer hold.
- Maricopa County population projected at +38% by 2050 — long-run rental-demand tailwind backs the buy-and-hold thesis.
Negotiation context
- It's been on market 60 days — a 3% lower offer ($262k) is reasonable based on typical stale-listing flexibility.
- 3 sale attempts; this cycle's ask has dropped $30k (10%) from the opening price — seller is motivated, your offer sets the floor, not the list.
- Current owner paid $14k; list at $270k implies a 1876% gain — meaningful room to come down on a strong offer.
Risks & watch-outs
- Watch-outs: built in 1940 — expect roof / HVAC / electrical / plumbing capex.
- Climate carrying-cost: extreme-heat days projected 7→19/yr by 2055 (HVAC capex compounding) — expect insurance premiums to compound above CPI over the hold.
Questions for the listing agent
- It's been on market 60 days. Have you received any prior offers? Is the seller open to a 18% concession, seller financing, or rate buy-down credit?
- Built in 1940 — when were the roof, HVAC, electrical panel, plumbing, and water heater last replaced?
- Is there a deadline driving the sale (1031 exchange, divorce, estate, relocation)? That informs how much negotiation room exists.
- Crime grade is F in this area — have there been break-ins, vandalism, or insurance claims at this property in the last 3 years? What carrier currently insures it and at what premium?
- What's the average days-on-market for RENTAL listings here right now (not sales)? A rising rental-DOM trend means longer vacancies and softer asking-rent achievability than the comps imply.
- What's the recent tenant-quality profile in this submarket — average credit score on applications, eviction rate, late-payment / NSF rate, and stable-employment percentage? A property-management company in the area should have these aggregated.
- How much new for-sale + rental construction is in the pipeline within 1–3 miles? Heavy new supply typically softens prices + rents 12–24 months out; constrained supply supports both.
Investment metrics
- 1% rule
- 0.82% ✗
- Cap rate
- 7.03%
- Cash-on-cash
- 2.63%
- DSCR
- 1.12
- GRM
- 10.2
CMA / ARV
- ARV (on-the-fly)
- $391,608
- Comps found
- 6
Show comp detail 6 sales within ~0.75 mi
| Address | Dist | Beds/Ba | Sqft | Sold | Price | $/sf | Match |
|---|---|---|---|---|---|---|---|
| 937 W Cocopah St | 0.04mi | 3/2.0 (+1) | 1,352 (-11%) | 2mo | $349,900 | $259 | 74 |
| 1105 W Cocopah St | 0.09mi | 3/2.0 (+1) | 1,612 (+7%) | 10mo | $319,700 | $198 | 72 |
| 1309 S 1st Ave | 0.65mi | 3/2.0 (+1) | 1,470 (-3%) | 6mo | $437,000 | $297 | 55 |
| 1102 S 4th Ave | 0.47mi | 3/2.5 (+1) | 1,623 (+7%) | 8mo | $425,000 | $262 | 52 |
| 1644 W Sonora St | 0.54mi | 3/1.5 (+1) | 1,376 (-9%) | 2mo | $314,000 | $228 | 51 |
| 1605 W Hadley St | 0.67mi | 3/2.0 (+1) | 1,340 (-11%) | 19mo | $316,000 | $236 | 29 |
Match score weights: distance 35% · size 25% · config 20% · recency 20%. Top-matched comps best support the ARV.
Projected returns pro-forma
-3.0% appreciation · 1.35% rent growth · sell at horizon
- IRR
- -13.8%
- Equity multiple
- 0.51×
- Total profit
- $-36,963
- Equity at exit
- $40,258
- IRR
- -7.5%
- Equity multiple
- 0.56×
- Total profit
- $-33,505
- Equity at exit
- $23,345
Cash invested: $75,600 (down + closing). Projections, not guarantees.
Landlord ↔ Tenant lean methodology
- Overall (STATE)
- 87 Strongly Landlord-Friendly
- State Arizona
- 87 Strongly Landlord-Friendly · R+3
- County
- — inherits STATE
- City
- — inherits STATE
ZIP-level market 85007
- Home prices YoY
- -28.9%
- Rents YoY
- 1.4%
- Active inventory
- 88
- Price-to-rent
- 10.2×
Monthly cashflow live
- Estimated rent
- $2,205 high interval (Pro) →
- Mortgage (P&I)
- −$1,416
- Tax from tax record
- −$48 /mo · $576/yr
- Insurance
- −$112
- HOA
- −$0
- Vacancy / Maint / Mgmt
- −$463
- Net cashflow
- $165
Break-even live
Sensitivity live
| Price | -10% $318 | -5% $242 | +0% $165 | +5% $89 | +10% $-311 |
|---|---|---|---|---|---|
| Rent | -10% $-9 | -5% $78 | +0% $165 | +5% $252 | +10% $340 |
| Rate | -1.0pp $301 | -0.5pp $234 | base $165 | +0.5pp $95 | +1.0pp $24 |
UW: 25.0% down · 7.5% · 30yr · 1.5% tax · 5.0% vac · 8.0% maint · 8.0% mgmt
Financing live
Cash to close
- Down payment
- $67,500
- Closing costs
- $8,100
- Reserves months
- —
- Total cash needed
- —
Loan-product check · same deal, 3 products live
Conventional
25% down · 7.5% · 30yr
- Down + closing
- —
- Monthly P&I
- —
- Monthly cashflow
- —
- DSCR
- —
- Eligible?
- —
Personal DTI + credit; lowest rate.
DSCR
20% down · 8.5% · 30yr
- Down + closing
- —
- Monthly P&I
- —
- Monthly cashflow
- —
- DSCR
- —
- Eligible?
- —
No personal income docs; deal must DSCR.
Hard money
10% down · 12.0% · 12mo
- Down + closing
- —
- Monthly P&I
- —
- Monthly cashflow
- —
- DSCR
- —
- Eligible?
- —
Short-term bridge; refi at stabilization.
Rent comps 23 comps
| Address | Beds | Baths | Sqft | Rent | $/sqft | DOM | Units | Dist |
|---|---|---|---|---|---|---|---|---|
| 1325 W Apache St Phoenix, AZ | 3.0 | 2.0 | 1885 | $1,675 | $0.89 | 9d | 1 | 0.27mi |
| 382 W Cocopah St Phoenix, AZ | 3.0 | 2.0 | 1294 | $1,795 | $1.39 | 0d | 1 | 0.35mi |
| 917 S 5th Ave Apt 2 Phoenix, AZ | 3.0 | 2.5 | 1500 | $2,199 | $1.47 | 0d | 1 | 0.56mi |
| 402 W Lincoln St Phoenix, AZ | 1.0–2.0 | 1.0–2.0 | 893 | $2,234 | $2.50 | 0d | 23 | 0.74mi |
| 814 S 1st Ave Phoenix, AZ | 2.0 | 2.0 | 1247 | $1,995 | $1.60 | 0d | 1 | 0.80mi |
| 1714 S 5th St Phoenix, AZ | 3.0 | 2.5 | 1576 | $2,350 | $1.49 | 0d | 1 | 1.06mi |
| 424 S 2nd St #208 Phoenix, AZ | 1.0 | 2.0 | 1710 | $3,000 | $1.75 | 0d | 1 | 1.14mi |
| 411 S 3rd St Phoenix, AZ | 2.0 | 1.0–2.0 | 1006 | $3,559 | $3.54 | 0d | 34 | 1.24mi |
| 2135 W Hadley St Unit 2 Phoenix, AZ | 3.0 | 1.0 | 1682 | $1,800 | $1.07 | 0d | 1 | 1.25mi |
| 11 S Central Ave Phoenix, AZ | 1.0 | 2.0 | 1385 | $3,252 | $2.35 | 23d | 1 | 1.29mi |
| 1326 W Monroe St Unit 1326 Phoenix, AZ | 2.0 | 1.5 | 1050 | $1,695 | $1.61 | 0d | 1 | 1.30mi |
| 114 W Adams St #1008 Phoenix, AZ | 2.0 | 2.0 | 1174 | $2,495 | $2.13 | 3d | 1 | 1.35mi |
| 114 W Adams St Phoenix, AZ | 1.0–2.0 | 1.0–2.0 | 1003 | $2,600 | $2.59 | 19d | 2 | 1.36mi |
| 114 W Adams St Phoenix, AZ | 1.0–2.0 | 1.0–2.0 | 1003 | $2,495 | $2.49 | 0d | 2 | 1.36mi |
| 114 W Adams St Phoenix, AZ | 1.0–2.0 | 1.0–2.0 | 1003 | $2,495 | $2.49 | 3d | 2 | 1.36mi |
| 188 E Jefferson St Phoenix, AZ | 2.0 | 1.0–2.0 | 944 | $3,595 | $3.81 | 0d | 26 | 1.37mi |
| 222 E Jefferson St Phoenix, AZ | 2.0 | 1.0–2.5 | 1135 | $4,225 | $3.72 | 0d | 49 | 1.37mi |
| 1350 W Van Buren St Phoenix, AZ | 3.0 | 1.0–2.0 | 897 | $1,620 | $1.81 | 0d | 13 | 1.40mi |
| 44 W Monroe St Phoenix, AZ | 1.0–2.0 | 1.5–2.0 | 1178 | $3,287 | $2.79 | 0d | 14 | 1.43mi |
| 121 S 21st Ave Phoenix, AZ | 3.0 | 1.0 | 1350 | $2,200 | $1.63 | 0d | 1 | 1.44mi |
| 18 W Monroe St Unit 1263177P Phoenix, AZ | 1.0 | 1.5 | 1119 | $3,156 | $2.82 | 3d | 1 | 1.45mi |
| 601 W Fillmore St Phoenix, AZ | 1.0–2.0 | 1.0–2.0 | 930 | $1,987 | $2.14 | 0d | 17 | 1.48mi |
| 50 W Van Buren St Phoenix, AZ | 2.0 | 1.0–2.0 | 1231 | $8,455 | $6.87 | 0d | 123 | 1.49mi |
Listing history 23 events
-
2026-06-21days on market $270,000 Active 60 DOM
-
2026-06-18days on market $270,000 Active 57 DOM
-
2026-06-17days on market $270,000 Active 56 DOM
-
2026-06-16days on market $270,000 Active 55 DOM
-
2026-06-15days on market $270,000 Active 54 DOM
-
2026-06-13days on market $270,000 Active 52 DOM
-
2026-06-13days on market $270,000 Active 51 DOM
-
2026-06-09days on market $270,000 Active 48 DOM
-
2026-06-08days on market $270,000 Active 47 DOM
-
2026-06-07days on market $270,000 Active 46 DOM
-
2026-06-04pricedays on market $270,000 Active 43 DOM
-
2026-06-03days on market $250,000 Active 42 DOM
-
2026-06-02days on market $250,000 Active 41 DOM
-
2026-06-01days on market $250,000 Active 40 DOM
-
2026-05-31days on market $250,000 Active 39 DOM
-
2026-05-07status Active
-
2026-05-07price $250,000
-
2026-04-29historical Under Contract Accepting Backups
-
2026-04-26status Active
-
2026-03-30status Pending
-
2026-03-27$300,000 Active
-
2024-06-14soldstatus $13,667
-
2024-04-05soldstatus $13,166
ⓘ Source: listings_history table (triggers on properties + properties_extension) + one-shot
backfill from property_details.listing_events for pre-trigger history.
Tax reassessment forecast AZ · Resets to sale price
- Current annual tax
- $576 · $48/mo
- Projected year-2 tax
- $1,782 · $148/mo
- Expected delta
- +$1,206/yr (+$100/mo · 209.2%)
ⓘ Screening estimate from a state-policy table — verify with the county assessor before closing.
Climate risk First Street
- Flood 1/10 Low FEMA zone X (shaded) · 0% chance over 30 yrs
- Wildfire 1/10 Low
- Heat 9/10 Extreme 7 d/yr ≥112°F today · 19 d/yr by 30 yrs out
- Wind 1/10 Low
- Air quality 2/10 Low 2 unhealthy d/yr today · 2 by 30 yrs out
Nearby sold comps map
Loading sold comps map…
Walkable amenities ~0.75 mi
Loading nearby amenities…
Taxation est. · year 1
- Rental income
- $26,458
- − Mortgage interest
- −$15,124
- − Property taxes
- −$576
- − Insurance
- −$1,350
- − Repairs & maintenance
- −$2,117
- − Management
- −$2,117
- − Depreciation
- −$7,855
- Taxable loss
- −$2,680
- Est. tax savings @ 24.0%
- +$643
- After-tax cash flow
- $2,628/yr
For passive investors: Depreciation is non-cash, so a rental often shows a tax loss while cash-flowing — sheltering income. Rental losses are passive: they offset passive income freely, and up to $25,000/yr can offset ordinary (W-2) income if you actively participate and your MAGI is under $100k (phasing out to $0 by $150k); unused losses carry forward. On sale, claimed depreciation is recaptured at up to 25%, and gains may owe capital-gains tax (a 1031 exchange can defer both). Figures are a year-1 estimate at your 24.0% rate — not tax advice; consult a CPA.
Schools (NCES district)
- District
- Phoenix Union High School District (4286)
- NCES district ID
- 0406330
- Math proficiency
- 10% ▼ -27.00%
- Reading proficiency
- 15% ▼ -18.00%
- Median HH income
- $39,055
- Composite
- 10.63/100
- National rank
- #9773
- State rank
- #224 of 249 in AZ
Livability — Phoenix
- Score
- 75/100
- State rank
- #16
- US rank
- #3924
Category grades
Schools grade is shown separately in the Schools card above.
Census & demographics
- Census place
- Phoenix, AZ
- County
- Maricopa County · 4,537,380 people
- City population
- 1,500,198
- Metro
- Phoenix-Mesa-Chandler, AZ
- Population (ZIP)
- 13,575
- Household income
- $63,616
- Rent vs Own
- Severe rent burden
- 541.0
Population outlook (Maricopa County) Hauer SSP2
- Today (2025)
- 4,979,203 people
- By 2030
- 5,378,229 · +8.0%
- By 2040
- 6,156,598 · +23.6%
- By 2050
- 6,872,376 · +38.0%
- By 2075
- 8,401,270 · +68.7%
- By 2100
- 9,247,439 · +85.7%
Race, ethnicity, and origin ACS 2023
- Neighborhood character
- Diverse neighborhood (Simpson 0.60)
- Race & ethnicity
- Hispanic / Latino 53% Two or more races 37% White 34% Black 8% Native American 2% Asian 2%
- Hispanic origin (detail)
- Mexican 48% Puerto Rican 1%
- Common ancestry
- Italian 4% Portuguese 2% Lithuanian 2%
- Foreign-born
- 16% · Canada, China
- Languages at home
- 65% English-only · Spanish 32% German/W. Germanic 1% Chinese 1%
Political lean MEDSL · Maricopa
- 2024 margin
- Toss-up / Even · D 47.7% · R 51.2% · Other 1.1%
- 2008→2024 swing
- +7.1pp toward D · 2008: -10.6pp · 2024: -3.5pp
- All cycles
- 2024: R+3.5 2020: D+2.2 2016: R+3.5 2012: R+12.0 2008: R+10.6
Not yet ingested
- Civics
- —
Market trends
- HPI YoY
- ▼ -158.06%
- Current HPI
- 388.9189
- Rent YoY
- ▲ 1.35%
- Metro
- Phoenix-Mesa-Chandler, AZ
- State GDP YoY
- ▲ 4.54%
- F500 in state
- 20
Industry mix (Fortune 500 HQ in AZ)
| Industry | F500 HQs | Revenue |
|---|---|---|
| Technology | 2 | $13B |
|
||
| Mining / Metals | 1 | $23B |
|
||
| Environmental Services | 1 | $16B |
|
||
| Metals / Steel | 1 | $14B |
|
||
| Technology Distribution | 1 | $9B |
|
||
| Homebuilding | 1 | $8B |
|
||
Price history
+1798.8% since first listed8 events — show timeline
- 2026-05-07 Relisted — ARMLS
- 2026-05-07 Price Changed $250,000 ARMLS
- 2026-04-29 Contingent — ARMLS
- 2026-04-26 Relisted — ARMLS
- 2026-03-30 Pending — ARMLS
- 2026-03-27 Listed $300,000 ARMLS
- 2024-06-14 Sold (Public Records) $13,667 Public Records
- 2024-04-05 Sold (Public Records) $13,166 Public Records
Property tax history
-1.7%/yrLatest (2025): $576 · +6.2% YoY. Source: county tax records.
Cash-flow waterfall
monthlySold comps — $/sqft
last 12 mo · ≤1 miLoading sold comps…