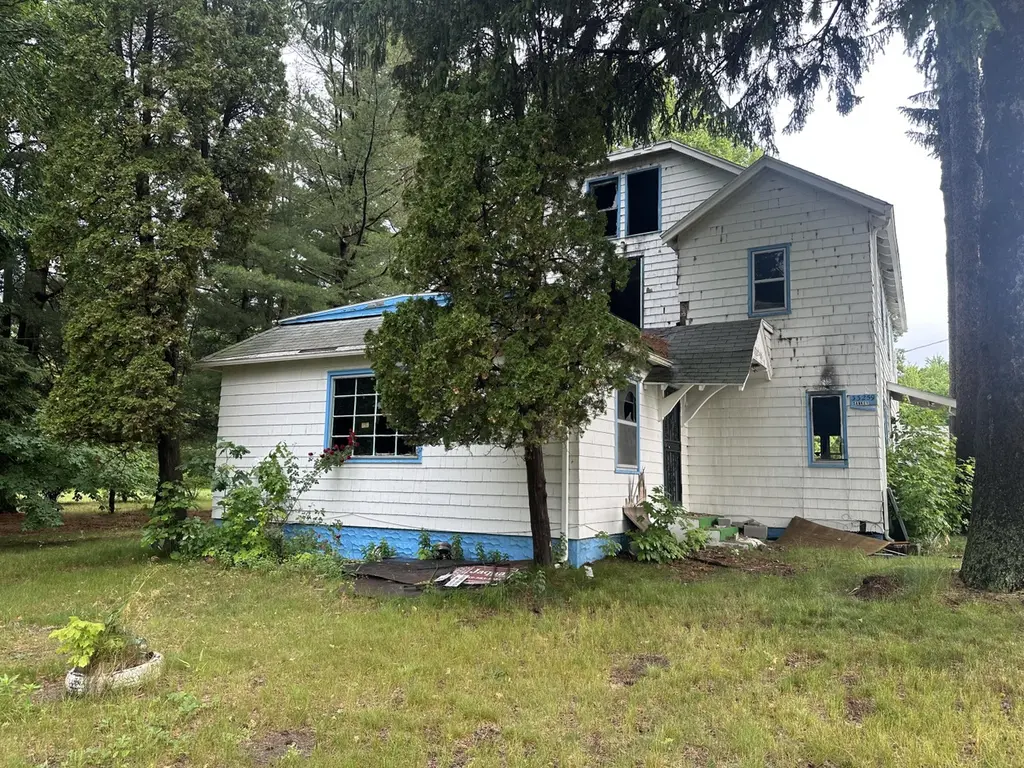
33259 Orchard St
Covert, MI 49043
$155,000D+
5 bd · 1.0 ba ·
1,904 sqft ·
Built 1970
· SingleFamily
· Active
· 12 DOM
Cashflow @ list (25.0% down · 7.5%)
Estimated rent
$1,321/mo
Mortgage (P&I)
−$813
Tax + insurance
−$182
HOA
−$0
Vac / Maint / Mgmt
−$277
Net cashflow
$48/mo
Annual
$580/yr
Cap rate
6.67%
Cash-on-cash
1.34%
DSCR
1.06
1% rule
0.85%
Cash to close
$43,400
Investor read
- This is a 5-bed/1.0-bath single-family listed at $155k.
- At list price, monthly cash flow is $48 ($580/yr) — positive.
- The deal already cash-flows at list — no discount required.
- To meet the 1% rule (rent ≥ 1% of price), the offer needs to be $132k (14.8% below list).
- Only 12 days on market — expect competitive offers; lowballing is unlikely to land.
- Recommended offer: $132k (14.8% below list) — sets the bar for 1% rule.
- In year one you build about $12k of equity ($1k loan paydown + $11k appreciation (6.8% local appreciation)).
- Location reads: area grade D — affects rentability + tenant quality, not the cash-flow math above.
- Covert Public Schools (rural): math 15% / reading 30% proficiency, ranked #630 of 760 in MI (top 83%) — low school quality limits family demand, transient renter base, plan for 1-2y turnover; 91% free/reduced lunch — lower-income household profile, screen leases tightly.
- Zoned schools: Covert Elementary School (math 2% / reading 27%, grade F, #1,172 of 1,397 statewide, top 85%, 140 students, 90% FRL); Covert Middle School (math 12% / reading 27%, grade F, #425 of 493 statewide, top 87%, 65 students, 92% FRL); Covert High School (math 10% / reading 30%, grade F, #596 of 713 statewide, top 86%, 103 students, 82% FRL) — zoned schools at 88% FRL track the district average.
- Market conditions: 26 active listings in the ZIP; 165 units permitted in Van Buren County in 2024 (0 in 5+ unit buildings).
- Van Buren County population projected at -23% by 2050 — secular population decline; favor cash flow + early exit over multi-decade hold.
- 5 sale attempts since 2y ago with the ask held roughly flat each time — persistent listings suggest the price (not the market) is what's stuck; bring a comps-based counter.
- At projected returns (6.8% appreciation + 3.0% rent growth), your $43k cash investment doubles in ~4 years — after that, you're playing with house money.
- By year 4, paydown + projected appreciation supports a ~$40k cash-out refi (75% LTV) — recoverable capital for the next deal without selling this one.
Questions for listing agent
- Built in 1970 — when were the roof, HVAC, electrical panel, plumbing, and water heater last replaced?
- Is there a deadline driving the sale (1031 exchange, divorce, estate, relocation)? That informs how much negotiation room exists.
- The area grade is low — what's the realistic commute time and amenity access for the typical tenant pool here? Any planned neighborhood developments (good or bad) we should know about?
- What's the average days-on-market for RENTAL listings here right now (not sales)? A rising rental-DOM trend means longer vacancies and softer asking-rent achievability than the comps imply.
- What's the recent tenant-quality profile in this submarket — average credit score on applications, eviction rate, late-payment / NSF rate, and stable-employment percentage? A property-management company in the area should have these aggregated.
- How much new for-sale + rental construction is in the pipeline within 1–3 miles? Heavy new supply typically softens prices + rents 12–24 months out; constrained supply supports both.
CashFlowRE · CFR-YMZQ0526KZ7JNZ
· Data 15 h ago
cashflowre.app · 2026-05-29