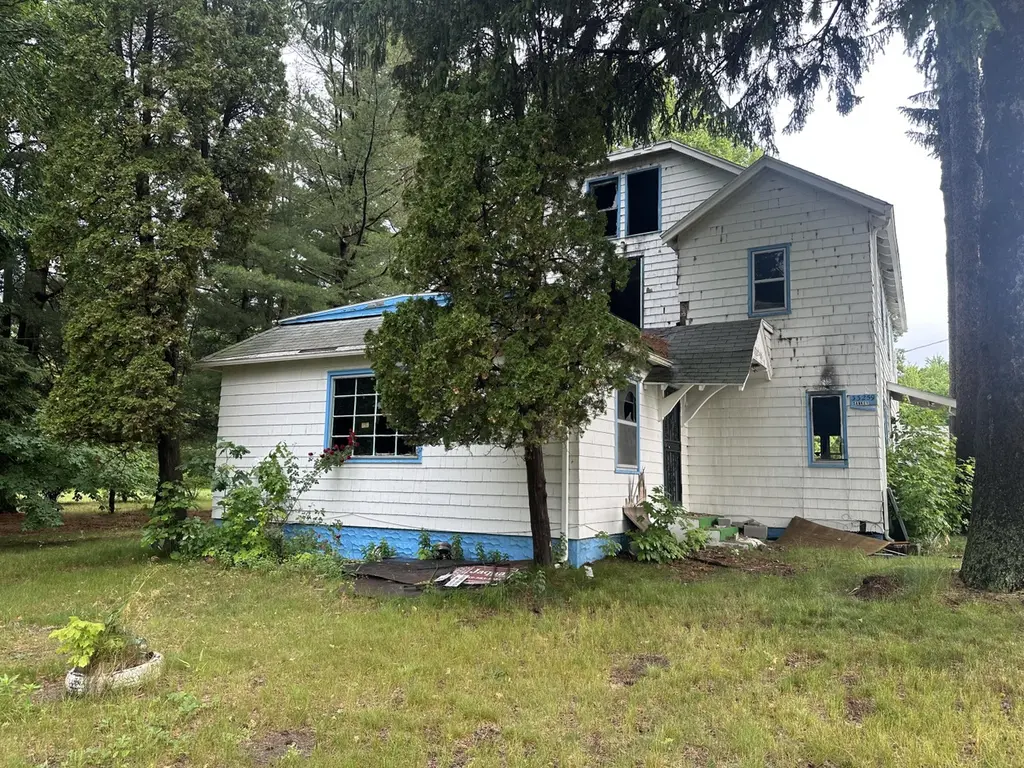
33259 Orchard St · Covert, MI
Flood risk 1/10 · Minimal
- FEMA flood zone
- X (unshaded)
- Chance of flooding over 30 yrs
- 0.0%
- Est. flood insurance / yr
- $473 – $860
Fire risk 3/10 · Minor
- Est. fire insurance / yr
- $784 – $1,456
Heat risk 2/10 · Minimal
- Hot days now (above 98°F)
- 7 days/yr
- Hot days in 30 yrs
- 15 days/yr
Wind risk 2/10 · Minimal
- Chance of severe wind over 30 yrs
- —
Air-quality risk 4/10 · Minor
- Unhealthy air days now
- 5 days/yr
- Unhealthy air days in 30 yrs
- 7 days/yr
Risk factors via First Street. Map © Google.
Why this score? — see what drove the D+ grade
The composite is a weighted blend of 9 inputs, each scored 0–100. Each bar is that input's sub-score; the figure is the points it added to the 100-point composite (weight × sub-score).
- Cash flow +15.0/30.0
- Appreciation +8.4/10.0
- ARV discount +7.5/15.0
- DSCR +4.6/10.0
- 1% rule +3.5/10.0
- Rent growth +2.5/5.0
- Livability +2.5/5.0
- Condition / age +2.5/5.0
- Schools +2.1/10.0
$155,000
🖨 Deal sheet (PDF) 📄 Offer letter ✓ Due diligence
Listing remarks MLS
Set on over 8 serene acres in Covert Township, this property offers a rare opportunity for those looking to restore, rebuild, or create their own vision. Originally a spacious Colonial home featuring 5 bedrooms, 2 full bathrooms, approximately 2,460 square feet, a four-season room, great room, dining area, and generous living spaces, the residence sustained significant fire damage in February 2025 and is being sold strictly as-is. The value is reflected in the acreage, setting, existing improvements, and potential for redevelopment. A unique opportunity to bring new life to a beautiful piece of property with room to roam.
Key facts
- Four-season room
- Dining area
- Over 8 acres
Tags
Property features AI
Exterior
- Parking: Detached 2-car garage
- Utilities: Natural gas connected
- Home design: Colonial-style single-family residence; Built in 1970
- Construction: Brick, shingle siding, and wood siding exterior; Asphalt roof; Crawl space / Michigan-style basement
- Exterior features: Corner lot; Wooded setting; Public water
Interior
- Bathrooms: 2 full bathrooms
- Heating & cooling: Forced air heating
- Interior features: 11 total rooms; Bay/Bow windows; Window treatments
Neighborhood map
What this means for you Summary
Snapshot
- This is a 5-bed/1.0-bath single-family listed at $155k.
Deal economics
- At list price, monthly cash flow is $48 ($580/yr) — positive.
- The deal already cash-flows at list — no discount required.
- To meet the 1% rule (rent ≥ 1% of price), the offer needs to be $132k (14.8% below list).
- Recommended offer: $132k (14.8% below list) — sets the bar for 1% rule.
Location & tenants
- Location reads: area grade D — affects rentability + tenant quality, not the cash-flow math above.
- Covert Public Schools (rural): math 15% / reading 30% proficiency, ranked #630 of 760 in MI (top 83%) — low school quality limits family demand, transient renter base, plan for 1-2y turnover; 91% free/reduced lunch — lower-income household profile, screen leases tightly.
- Zoned schools: Covert Elementary School (math 2% / reading 27%, grade F, #1,172 of 1,397 statewide, top 85%, 140 students, 90% FRL); Covert Middle School (math 12% / reading 27%, grade F, #425 of 493 statewide, top 87%, 65 students, 92% FRL); Covert High School (math 10% / reading 30%, grade F, #596 of 713 statewide, top 86%, 103 students, 82% FRL) — zoned schools at 88% FRL track the district average.
- Market conditions: 26 active listings in the ZIP; 165 units permitted in Van Buren County in 2024 (0 in 5+ unit buildings).
Forward outlook
- In year one you build about $12k of equity ($1k loan paydown + $11k appreciation (6.8% local appreciation)).
- Van Buren County population projected at -23% by 2050 — secular population decline; favor cash flow + early exit over multi-decade hold.
- At projected returns (6.8% appreciation + 3.0% rent growth), your $43k cash investment doubles in ~4 years — after that, you're playing with house money.
- By year 4, paydown + projected appreciation supports a ~$40k cash-out refi (75% LTV) — recoverable capital for the next deal without selling this one.
Negotiation context
- Only 12 days on market — expect competitive offers; lowballing is unlikely to land.
- 5 sale attempts since 2y ago with the ask held roughly flat each time — persistent listings suggest the price (not the market) is what's stuck; bring a comps-based counter.
Questions for the listing agent
- Built in 1970 — when were the roof, HVAC, electrical panel, plumbing, and water heater last replaced?
- Is there a deadline driving the sale (1031 exchange, divorce, estate, relocation)? That informs how much negotiation room exists.
- The area grade is low — what's the realistic commute time and amenity access for the typical tenant pool here? Any planned neighborhood developments (good or bad) we should know about?
- What's the average days-on-market for RENTAL listings here right now (not sales)? A rising rental-DOM trend means longer vacancies and softer asking-rent achievability than the comps imply.
- What's the recent tenant-quality profile in this submarket — average credit score on applications, eviction rate, late-payment / NSF rate, and stable-employment percentage? A property-management company in the area should have these aggregated.
- How much new for-sale + rental construction is in the pipeline within 1–3 miles? Heavy new supply typically softens prices + rents 12–24 months out; constrained supply supports both.
Investment metrics
- 1% rule
- 0.85% ✗
- Cap rate
- 6.67%
- Cash-on-cash
- 1.34%
- DSCR
- 1.06
- GRM
- 9.8
CMA / ARV
No comps found within radius.
Projected returns pro-forma
6.83% appreciation · 3.0% rent growth · sell at horizon
- IRR
- 18.4%
- Equity multiple
- 2.28×
- Total profit
- $55,527
- Equity at exit
- $105,655
- IRR
- 17.6%
- Equity multiple
- 4.67×
- Total profit
- $159,224
- Equity at exit
- $199,126
Cash invested: $43,400 (down + closing). Projections, not guarantees.
Landlord ↔ Tenant lean methodology
- Overall (STATE)
- 62 Landlord-Friendly
- State Michigan
- 62 Landlord-Friendly · EVEN
- County
- — inherits STATE
- City
- — inherits STATE
ZIP-level market 49043
- Home prices YoY
- 3.7%
- Active inventory
- 26
- Price-to-rent
- 9.8×
Monthly cashflow live
- Estimated rent
- $1,321 medium interval (Pro) →
- Mortgage (P&I)
- −$813
- Tax from tax record
- −$118 /mo · $1,415/yr
- Insurance
- −$65
- HOA
- −$0
- Vacancy / Maint / Mgmt
- −$277
- Net cashflow
- $48
Break-even live
Sensitivity live
| Price | -10% $136 | -5% $92 | +0% $48 | +5% $4 | +10% $-39 |
|---|---|---|---|---|---|
| Rent | -10% $-56 | -5% $-4 | +0% $48 | +5% $101 | +10% $153 |
| Rate | -1.0pp $126 | -0.5pp $88 | base $48 | +0.5pp $8 | +1.0pp $-33 |
UW: 25.0% down · 7.5% · 30yr · 1.5% tax · 5.0% vac · 8.0% maint · 8.0% mgmt
Financing live
Cash to close
- Down payment
- $38,750
- Closing costs
- $4,650
- Reserves months
- —
- Total cash needed
- —
Loan-product check · same deal, 3 products live
Conventional
25% down · 7.5% · 30yr
- Down + closing
- —
- Monthly P&I
- —
- Monthly cashflow
- —
- DSCR
- —
- Eligible?
- —
Personal DTI + credit; lowest rate.
DSCR
20% down · 8.5% · 30yr
- Down + closing
- —
- Monthly P&I
- —
- Monthly cashflow
- —
- DSCR
- —
- Eligible?
- —
No personal income docs; deal must DSCR.
Hard money
10% down · 12.0% · 12mo
- Down + closing
- —
- Monthly P&I
- —
- Monthly cashflow
- —
- DSCR
- —
- Eligible?
- —
Short-term bridge; refi at stabilization.
Listing history 10 events
-
2026-06-21days on market $155,000 Active 12 DOM
-
2026-06-21days on market $155,000 Active 11 DOM
-
2026-06-18days on market $155,000 Active 9 DOM
-
2026-06-17days on market $155,000 Active 8 DOM
-
2026-06-16days on market $155,000 Active 7 DOM
-
2026-06-15days on market $155,000 Active 6 DOM
-
2026-06-13days on market $155,000 Active 4 DOM
-
2026-06-12days on market $155,000 Active 3 DOM
-
2026-06-09remarks 629-char remark
-
2026-06-09$155,000 Active 1 DOM
ⓘ Source: listings_history table (triggers on properties + properties_extension) + one-shot
backfill from property_details.listing_events for pre-trigger history.
Tax reassessment forecast MI · Partial reset (capped growth)
- Current annual tax
- $1,415 · $118/mo
- Projected year-2 tax
- $1,901 · $158/mo
- Expected delta
- +$486/yr (+$41/mo · 34.4%)
ⓘ Screening estimate from a state-policy table — verify with the county assessor before closing.
Climate risk First Street
- Flood 1/10 Low FEMA zone X (unshaded) · 0% chance over 30 yrs
- Wildfire 3/10 Moderate
- Heat 2/10 Low 7 d/yr ≥98°F today · 15 d/yr by 30 yrs out
- Wind 2/10 Low
- Air quality 4/10 Moderate 5 unhealthy d/yr today · 7 by 30 yrs out
Nearby sold comps map
Loading sold comps map…
Walkable amenities ~0.75 mi
Loading nearby amenities…
Taxation est. · year 1
- Rental income
- $15,853
- − Mortgage interest
- −$8,682
- − Property taxes
- −$1,415
- − Insurance
- −$775
- − Repairs & maintenance
- −$1,268
- − Management
- −$1,268
- − Depreciation
- −$4,509
- Taxable loss
- −$2,065
- Est. tax savings @ 24.0%
- +$496
- After-tax cash flow
- $1,076/yr
For passive investors: Depreciation is non-cash, so a rental often shows a tax loss while cash-flowing — sheltering income. Rental losses are passive: they offset passive income freely, and up to $25,000/yr can offset ordinary (W-2) income if you actively participate and your MAGI is under $100k (phasing out to $0 by $150k); unused losses carry forward. On sale, claimed depreciation is recaptured at up to 25%, and gains may owe capital-gains tax (a 1031 exchange can defer both). Figures are a year-1 estimate at your 24.0% rate — not tax advice; consult a CPA.
Schools (NCES district)
- District
- Covert Public Schools
- NCES district ID
- 2610980
- Math proficiency
- 15% ▬ 0.00%
- Reading proficiency
- 30% ▲ 5.00%
- Median HH income
- $29,349
- Composite
- 21.13/100
- National rank
- #13687
- State rank
- #630 of 760 in MI
Livability — Covert
No livability data for this city. (Only ~50 U.S. cities are tracked.)
Census & demographics
- Population (ZIP)
- 2,264
Population outlook (Van Buren County) Hauer SSP2
- Today (2025)
- 71,479 people
- By 2030
- 68,693 · -3.9%
- By 2040
- 62,093 · -13.1%
- By 2050
- 55,232 · -22.7%
- By 2075
- 40,786 · -42.9%
- By 2100
- 27,785 · -61.1%
Race, ethnicity, and origin ACS 2023
- Neighborhood character
- Diverse neighborhood (Simpson 0.69)
- Race & ethnicity
- White 36% Hispanic / Latino 32% Black 27% Two or more races 21%
- Hispanic origin (detail)
- Mexican 28%
- Common ancestry
- Romanian 1% Slovak 1%
- Foreign-born
- 16% · Canada
- Languages at home
- 68% English-only · Spanish 29% Russian/Polish/Slavic 1% Other Indo-European 1%
Political lean MEDSL · Van Buren
- 2024 margin
- R (+15.1) · D 41.7% · R 56.9% · Other 1.4%
- 2008→2024 swing
- -23.9pp toward R · 2008: 8.8pp · 2024: -15.1pp
- All cycles
- 2024: R+15.1 2020: R+12.3 2016: R+13.9 2012: D+0.5 2008: D+8.8
Not yet ingested
- Civics
- —
Market trends
- HPI YoY
- ▲ 6.83%
- Current HPI
- 192.9859
- Rent YoY
- —
- Metro
- —
- State GDP YoY
- ▲ 1.37%
- F500 in state
- 28
Industry mix (Fortune 500 HQ in MI)
| Industry | F500 HQs | Revenue |
|---|---|---|
| Automotive Parts | 3 | $48B |
|
||
| Automotive | 2 | $372B |
|
||
| Chemicals | 1 | $45B |
|
||
| Automotive Retail | 1 | $29B |
|
||
| Healthcare / Medical Devices | 1 | $23B |
|
||
| Automotive Technology | 1 | $20B |
|
||
Price history
-31.1% since first listed15 events — show timeline
- 2026-06-08 Listed $155,000 MiRealSource-MiMLS
- 2026-06-08 Listed $155,000 REALCOMP
- 2026-06-08 Listed $155,000 SW Michigan MLS
- 2025-02-22 Listing Removed — REALCOMP
- 2025-02-22 Listing Removed — MiRealSource-MiMLS
- 2025-02-15 Contingent — REALCOMP
- 2025-02-15 Contingent — MiRealSource-MiMLS
- 2025-02-13 Price Changed $175,000 MiRealSource-MiMLS
- 2025-02-13 Price Changed $175,000 REALCOMP
- 2025-02-12 Price Changed $175,000 SW Michigan MLS
- 2025-01-28 Price Changed $195,000 MiRealSource-MiMLS
- 2025-01-28 Price Changed $195,000 REALCOMP
- 2025-01-28 Price Changed $195,000 SW Michigan MLS
- 2024-11-12 Listed $225,000 MiRealSource-MiMLS
- 2024-11-12 Listed $225,000 REALCOMP
Property tax history
+2.7%/yrLatest (2024): $1,415 · +10.8% YoY. Source: county tax records.
Cash-flow waterfall
monthlySold comps — $/sqft
last 12 mo · ≤1 miLoading sold comps…