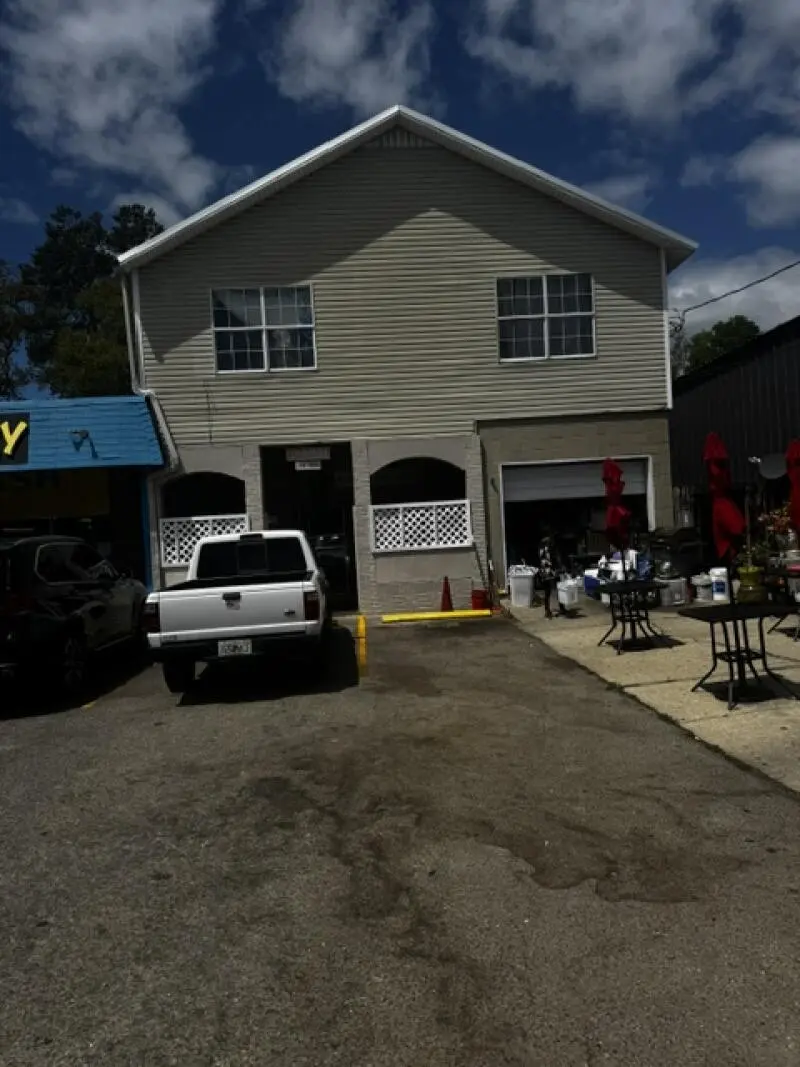
613 James Lee Rd
Wright, FL 32547
$175,000B
3 bd · 1.0 ba ·
2,398 sqft ·
Built 1967
· SingleFamily
· Pending
· 16 DOM
Cashflow @ list (25.0% down · 7.5%)
Estimated rent
$2,834/mo
Mortgage (P&I)
−$918
Tax + insurance
−$292
HOA
−$0
Vac / Maint / Mgmt
−$595
Net cashflow
$1,029/mo
Annual
$12,351/yr
Cap rate
13.35%
Cash-on-cash
25.21%
DSCR
2.12
1% rule
1.62%
Cash to close
$49,000
Investor read
- This is a 3-bed/1.0-bath single-family listed at $175k. Condition is rated poor.
- At list price, monthly cash flow is $1k ($12k/yr) — positive.
- The deal already cash-flows at list — no discount required.
- Meets the 1% rule at list price ($3k rent vs $175k).
- It's been on market 16 days — a 2% lower offer ($172k) is reasonable based on typical stale-listing flexibility.
- Recommended offer: $172k (1.5% below list) — sets the bar for market timing.
- Local home prices are declining (-3.0%/yr); year-one equity from $1k of loan paydown is wiped out by about $5k of value loss. Plan a longer hold.
- Location reads 80/100 on livability (#117 in FL, #1,790 nationally) — a professional / high-income tenant draw. Strengths: commute A+, cost of living A+, housing A+; Watch: schools D, amenities F.
- Okaloosa (other): math 60% / reading 60% proficiency, ranked #12 of 73 in FL (top 16%) — acceptable for families but not a draw, mixed tenant base, ~2y average lease.
- Market conditions: Rents soft (-0.1%/yr); 224 active listings in the ZIP; 9 comparable units currently listed for rent nearby; rentals lingering (median 45d on market — plan ~5-8 weeks vacancy on turnover, expect pricing pressure); 56% of comp listings sitting > 30 days — soft ceiling on asking rent; 1,268 units permitted in Okaloosa County in 2024 (175 in 5+ unit buildings).
- Okaloosa County population projected at +37% by 2050 — long-run rental-demand tailwind backs the buy-and-hold thesis.
- At projected returns (-3.0% appreciation + 0.0% rent growth), your $49k cash investment doubles in ~6 years — after that, you're playing with house money.
- Cap rate 13.4% vs local median 4.2% in Wright — top-decile yield for the area; either an underpriced asset or a hidden risk that comps aren't pricing in. Stress-test before assuming the spread holds.
- At $2,834/mo this rent would consume 48% of the median local household income ($71k/yr) (locally 1203% of renters already pay >50% of income on rent) — very limited rent-growth headroom before tenants either downsize or default.
Questions for listing agent
- Have any recent inspections been done? Can we get a copy of the seller's disclosures and any deferred-maintenance estimates?
- Built in 1967 — when were the roof, HVAC, electrical panel, plumbing, and water heater last replaced?
- Is there a deadline driving the sale (1031 exchange, divorce, estate, relocation)? That informs how much negotiation room exists.
- Schools are D-rated, which usually means shorter tenancies and higher turnover. Who's the typical renter profile here, and what's been the actual vacancy rate?
- What's the average days-on-market for RENTAL listings here right now (not sales)? A rising rental-DOM trend means longer vacancies and softer asking-rent achievability than the comps imply.
- What's the recent tenant-quality profile in this submarket — average credit score on applications, eviction rate, late-payment / NSF rate, and stable-employment percentage? A property-management company in the area should have these aggregated.
- How much new for-sale + rental construction is in the pipeline within 1–3 miles? Heavy new supply typically softens prices + rents 12–24 months out; constrained supply supports both.
Repairs flagged (vision-AI assessment)
- Major: exterior siding — Weathered and peeling
- Major: roof — No photos of roof
- Major: interior walls/paint — Worn and outdated
- Major: flooring — Worn and outdated
- Major: HVAC/mechanicals — No photos of HVAC/mechanicals
CashFlowRE · CFR-YNGAJHF225C0N5
· Data 3 weeks ago
cashflowre.app · 2026-05-29