 🏷️ Likely Rental
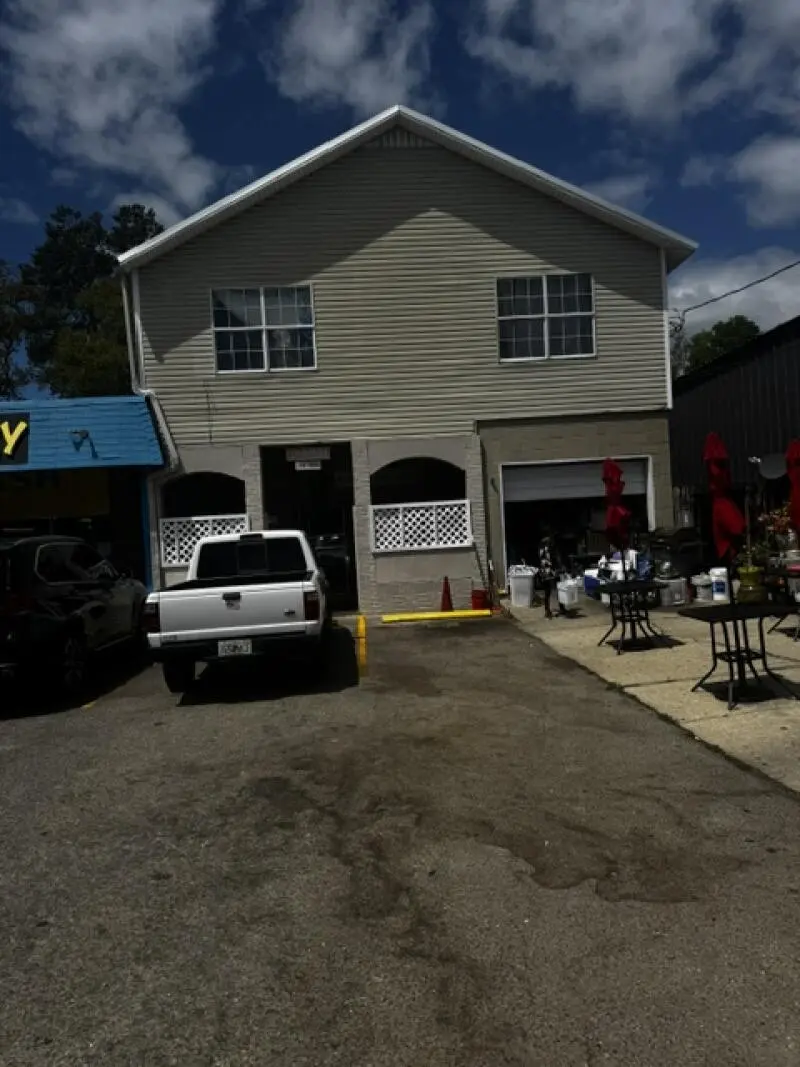
613 James Lee Rd · Wright, FL
Flood risk No data
- FEMA flood zone
- —
- Chance of flooding over 30 yrs
- —
- Est. flood insurance / yr
- —
Fire risk No data
- Est. fire insurance / yr
- —
Heat risk No data
- Hot days now (above threshold)
- —
- Hot days in 30 yrs
- —
Wind risk No data
- Chance of severe wind over 30 yrs
- —
Air-quality risk No data
- Unhealthy air days now
- —
- Unhealthy air days in 30 yrs
- —
Risk factors via First Street. Map © Google.
Why this score? — see what drove the B grade
The composite is a weighted blend of 9 inputs, each scored 0–100. Each bar is that input's sub-score; the figure is the points it added to the 100-point composite (weight × sub-score).
- Cash flow +30.0/30.0
- 1% rule +10.0/10.0
- DSCR +10.0/10.0
- ARV discount +7.5/15.0
- Schools +5.2/10.0
- Livability +4.0/5.0
- Rent growth +2.5/5.0
- Condition / age +1.5/5.0
- Appreciation +0.0/10.0
$175,000
🖨 Deal sheet 📄 Offer letter ✓ Due diligence
Listing remarks MLS
3BR/1BA ~2,000 sq ft single-family home on 2nd level needing full renovations. 1st level is a mixed use space that is currently used as a hair salon. Additionally there is a tenant food truck renting the front space of the property. The house has its own meter and the hair salon and food truck are on the same meter.
Key facts
- 4,356 sq ft lot
- Garage
- Built 1967
Neighborhood map
What this means for you Summary
Snapshot
- This is a 3-bed/1.0-bath single-family listed at $175k. Condition is rated poor.
Deal economics
- At list price, monthly cash flow is $1k ($12k/yr) — positive.
- The deal already cash-flows at list — no discount required.
- Meets the 1% rule at list price ($3k rent vs $175k).
- Recommended offer: $172k (1.5% below list) — sets the bar for market timing.
- Cap rate 13.4% vs local median 4.2% in Wright — top-decile yield for the area; either an underpriced asset or a hidden risk that comps aren't pricing in. Stress-test before assuming the spread holds.
Location & tenants
- Location reads 80/100 on livability (#117 in FL, #1,790 nationally) — a professional / high-income tenant draw. Strengths: commute A+, cost of living A+, housing A+; Watch: schools D, amenities F.
- Okaloosa (other): math 60% / reading 60% proficiency, ranked #12 of 73 in FL (top 16%) — acceptable for families but not a draw, mixed tenant base, ~2y average lease.
- Market conditions: Rents soft (-0.1%/yr); 224 active listings in the ZIP; 9 comparable units currently listed for rent nearby; rentals lingering (median 44d on market — plan ~5-8 weeks vacancy on turnover, expect pricing pressure); 56% of comp listings sitting > 30 days — soft ceiling on asking rent; 1,268 units permitted in Okaloosa County in 2024 (175 in 5+ unit buildings).
- At $2,834/mo this rent would consume 48% of the median local household income ($71k/yr) (locally 1203% of renters already pay >50% of income on rent) — very limited rent-growth headroom before tenants either downsize or default.
Forward outlook
- Local home prices are declining (-3.0%/yr); year-one equity from $1k of loan paydown is wiped out by about $5k of value loss. Plan a longer hold.
- Okaloosa County population projected at +37% by 2050 — long-run rental-demand tailwind backs the buy-and-hold thesis.
- At projected returns (-3.0% appreciation + 0.0% rent growth), your $49k cash investment doubles in ~6 years — after that, you're playing with house money.
Negotiation context
- It's been on market 16 days — a 2% lower offer ($172k) is reasonable based on typical stale-listing flexibility.
Questions for the listing agent
- Have any recent inspections been done? Can we get a copy of the seller's disclosures and any deferred-maintenance estimates?
- Built in 1967 — when were the roof, HVAC, electrical panel, plumbing, and water heater last replaced?
- Is there a deadline driving the sale (1031 exchange, divorce, estate, relocation)? That informs how much negotiation room exists.
- Schools are D-rated, which usually means shorter tenancies and higher turnover. Who's the typical renter profile here, and what's been the actual vacancy rate?
- What's the average days-on-market for RENTAL listings here right now (not sales)? A rising rental-DOM trend means longer vacancies and softer asking-rent achievability than the comps imply.
- What's the recent tenant-quality profile in this submarket — average credit score on applications, eviction rate, late-payment / NSF rate, and stable-employment percentage? A property-management company in the area should have these aggregated.
- How much new for-sale + rental construction is in the pipeline within 1–3 miles? Heavy new supply typically softens prices + rents 12–24 months out; constrained supply supports both.
Investment metrics
- 1% rule
- 1.62% ✓
- Cap rate
- 13.35%
- Cash-on-cash
- 25.21%
- DSCR
- 2.12
- GRM
- 5.1
CMA / ARV
- ARV (median comp)
- $388,081
- List price
- $175,000
- Delta
- -54.91%
- Verdict
- UNDERPRICED
- Comps
- 20 within 1.0 mi
Show comp detail 12 sales within ~0.75 mi
| Address | Dist | Beds/Ba | Sqft | Sold | Price | $/sf | Match |
|---|---|---|---|---|---|---|---|
| 613 James Lee Rd | 0.00mi | 3/1.0 | 2,398 (0%) | 1mo | $175,000 | $73 | 100 |
| 709 Concord Ct | 0.16mi | 4/2.0 (+1) | 2,302 (-4%) | 0mo | $538,600 | $234 | 77 |
| 129 Newcastle Cir | 0.23mi | 4/3.5 (+1) | 2,390 (-0%) | 1mo | $425,000 | $178 | 73 |
| 801 Patio Rd | 0.51mi | 4/2.0 (+1) | 2,340 (-2%) | 4mo | $545,000 | $233 | 60 |
| 511 Trenton St | 0.59mi | 4/3.0 (+1) | 2,392 (-0%) | 2mo | $559,300 | $234 | 58 |
| 730 Colony Ct | 0.39mi | 4/2.0 (+1) | 2,179 (-9%) | 4mo | $444,000 | $204 | 55 |
| 422 Gerold St | 0.46mi | 4/2.0 (+1) | 2,262 (-6%) | 13mo | $500,000 | $221 | 49 |
| 2372 Cummings Dr | 0.61mi | 4/3.0 (+1) | 2,422 (+1%) | 12mo | $545,000 | $225 | 47 |
| 827 Whitrock Ln | 0.30mi | 4/2.0 (+1) | 2,080 (-13%) | 14mo | $400,000 | $192 | 43 |
| 206 Forest Dr | 0.51mi | 4/4.0 (+1) | 2,206 (-8%) | 5mo | $559,000 | $253 | 42 |
| 606 Pelham Rd | 0.62mi | 3/3.0 | 2,702 (+13%) | 1mo | $775,000 | $287 | 41 |
| 2331 Cummings Dr | 0.70mi | 4/3.0 (+1) | 2,532 (+6%) | 9mo | $510,000 | $201 | 37 |
Match score weights: distance 35% · size 25% · config 20% · recency 20%. Top-matched comps best support the ARV.
Projected returns pro-forma
-3.0% appreciation · 0.0% rent growth · sell at horizon
- IRR
- 15.3%
- Equity multiple
- 1.59×
- Total profit
- $28,936
- Equity at exit
- $26,093
- IRR
- 21.6%
- Equity multiple
- 2.59×
- Total profit
- $77,690
- Equity at exit
- $15,131
Cash invested: $49,000 (down + closing). Projections, not guarantees.
Landlord ↔ Tenant lean methodology
- Overall (STATE)
- 87 Strongly Landlord-Friendly
- State Florida
- 87 Strongly Landlord-Friendly · R+3
- County
- — inherits STATE
- City
- — inherits STATE
ZIP-level market 32547
- Home prices YoY
- -29.3%
- Rents YoY
- -0.1%
- Active inventory
- 224
- Price-to-rent
- 5.1×
Monthly cashflow live
- Estimated rent
- $2,834 high interval (Pro) →
- Mortgage (P&I)
- −$918
- Tax est. 1.5%
- −$219 /mo · $2,625/yr
- Insurance
- −$73
- HOA
- −$0
- Vacancy / Maint / Mgmt
- −$595
- Net cashflow
- $1,029
Break-even live
UW: 25.0% down · 7.5% · 30yr · 1.5% tax · 5.0% vac · 8.0% maint · 8.0% mgmt
Financing live
Cash to close
- Down payment
- $43,750
- Closing costs
- $5,250
- Reserves months
- —
- Total cash needed
- —
Loan-product check · same deal, 3 products live
Conventional
25% down · 7.5% · 30yr
- Down + closing
- —
- Monthly P&I
- —
- Monthly cashflow
- —
- DSCR
- —
- Eligible?
- —
Personal DTI + credit; lowest rate.
DSCR
20% down · 8.5% · 30yr
- Down + closing
- —
- Monthly P&I
- —
- Monthly cashflow
- —
- DSCR
- —
- Eligible?
- —
No personal income docs; deal must DSCR.
Hard money
10% down · 12.0% · 12mo
- Down + closing
- —
- Monthly P&I
- —
- Monthly cashflow
- —
- DSCR
- —
- Eligible?
- —
Short-term bridge; refi at stabilization.
Rent comps 9 comps
| Address | Beds | Baths | Sqft | Rent | $/sqft | DOM | Units | Dist |
|---|---|---|---|---|---|---|---|---|
| 2394 Ellison Way Fort Walton Beach, FL | 4.0 | 2.5 | 2628 | $3,850 | $1.46 | 21d | 1 | 0.68mi |
| 16 Woodham Ave Fort Walton Beach, FL | 4.0 | 3.0 | 1600 | $2,000 | $1.25 | 43d | 1 | 0.72mi |
| 16 Chelsea Dr NW Fort Walton Beach, FL | 4.0 | 3.0 | 2089 | $2,895 | $1.39 | 21d | 1 | 0.75mi |
| 204 Devon Ct Fort Walton Beach, FL | 3.0 | 2.0 | 1599 | $2,000 | $1.25 | 44d | 1 | 0.93mi |
| 608 Manor Ct NW Fort Walton Beach, FL | 4.0 | 2.5 | 2485 | $2,900 | $1.17 | 43d | 1 | 1.10mi |
| 122 Beach Dr Fort Walton Beach, FL | 3.0 | 2.0 | 2235 | $2,400 | $1.07 | 21d | 1 | 1.16mi |
| 618 Country Club Ave NE Fort Walton Beach, FL | 4.0 | 2.0 | 2120 | $4,200 | $1.98 | 13d | 1 | 1.30mi |
| 810 Eglin Pkwy Fort Walton Beach, FL | 3.0 | 3.5 | 1905 | $2,995 | $1.57 | 43d | 1 | 1.41mi |
| 789 Barley Port Ln Fort Walton Beach, FL | 4.0 | 3.0 | 3049 | $3,695 | $1.21 | 43d | 1 | 1.49mi |
Listing history 3 events
-
2026-05-08status Pending 317-char remark
Show marketing remark (317 chars)
3BR/1BA ~2,000 sq ft single-family home on 2nd level needing full renovations. 1st level is a mixed use space that is currently used as a hair salon. Additionally there is a tenant food truck renting the front space of the property. The house has its own meter and the hair salon and food truck are on the same meter.
-
2026-05-05price $175,000 317-char remark
Show marketing remark (317 chars)
3BR/1BA ~2,000 sq ft single-family home on 2nd level needing full renovations. 1st level is a mixed use space that is currently used as a hair salon. Additionally there is a tenant food truck renting the front space of the property. The house has its own meter and the hair salon and food truck are on the same meter.
-
2026-04-21$185,000 Active 317-char remark
Show marketing remark (317 chars)
3BR/1BA ~2,000 sq ft single-family home on 2nd level needing full renovations. 1st level is a mixed use space that is currently used as a hair salon. Additionally there is a tenant food truck renting the front space of the property. The house has its own meter and the hair salon and food truck are on the same meter.
ⓘ Source: listings_history table (triggers on properties + properties_extension) + one-shot
backfill from property_details.listing_events for pre-trigger history.
Nearby sold comps map
Loading sold comps map…
Walkable amenities ~0.75 mi
Loading nearby amenities…
Taxation est. · year 1
- Rental income
- $34,005
- − Mortgage interest
- −$9,803
- − Property taxes
- −$2,625
- − Insurance
- −$875
- − Repairs & maintenance
- −$2,720
- − Management
- −$2,720
- − Depreciation
- −$5,091
- Taxable income
- $10,171
- Est. tax owed @ 24.0%
- −$2,441
- After-tax cash flow
- $9,910/yr
For passive investors: Depreciation is non-cash, so a rental often shows a tax loss while cash-flowing — sheltering income. Rental losses are passive: they offset passive income freely, and up to $25,000/yr can offset ordinary (W-2) income if you actively participate and your MAGI is under $100k (phasing out to $0 by $150k); unused losses carry forward. On sale, claimed depreciation is recaptured at up to 25%, and gains may owe capital-gains tax (a 1031 exchange can defer both). Figures are a year-1 estimate at your 24.0% rate — not tax advice; consult a CPA.
Condition & rehab AI · 4 photos
This property requires extensive renovations, including exterior and interior repairs, to become move-in ready. Significant value can be added through a comprehensive renovation that addresses structural issues and enhances the home's curb appeal and functionality.
Repairs flagged
- Major exterior siding — Weathered and peeling
- Major roof — No photos of roof
- Major interior walls/paint — Worn and outdated
- Major flooring — Worn and outdated
- Major HVAC/mechanicals — No photos of HVAC/mechanicals
Value-add opportunities
- Both exterior siding and roof repair — Enhances curb appeal and structural integrity
- Both interior paint and flooring — Improves aesthetics and functionality
- Both HVAC/mechanicals upgrade — Enhances comfort and energy efficiency
Renovation cost estimate screening
| Repair item | Severity | Est. cost |
|---|---|---|
| exterior siding · Weathered and peeling | Major | $15,000–50,000 |
| roof · No photos of roof | Major | $15,000–50,000 |
| interior walls/paint · Worn and outdated | Major | $15,000–50,000 |
| flooring · Worn and outdated | Major | $15,000–50,000 |
| HVAC/mechanicals · No photos of HVAC/mechanicals | Major | $15,000–50,000 |
| Total estimated repair cost · 5 items | $75,000–250,000 |
Value-add ROI direction
- Both exterior siding and roof repair — Enhances curb appeal and structural integrity ↑
- Both interior paint and flooring — Improves aesthetics and functionality ↑
- Both HVAC/mechanicals upgrade — Enhances comfort and energy efficiency ↑
ⓘ Cost ranges are severity-bucket heuristics (US national rule-of-thumb). Get contractor quotes + a written scope before underwriting a rehab budget.
Schools (NCES district)
- District
- Okaloosa
- NCES district ID
- 1201380
- Math proficiency
- 60% ▼ -12.00%
- Reading proficiency
- 60% ▼ -4.00%
- Median HH income
- $55,601
- Composite
- 51.62/100
- National rank
- #1705
- State rank
- #12 of 73 in FL
Livability — Wright
- Score
- 80/100
- State rank
- #117
- US rank
- #1790
Category grades
Schools grade is shown separately in the Schools card above.
Census & demographics
- Census place
- Wright, FL
- County
- Okaloosa County · 194,352 people
- City population
- 35,522
- Metro
- Crestview-Fort Walton Beach-Destin, FL
- Population (ZIP)
- 35,527
- Household income
- $70,711
- Rent vs Own
- Severe rent burden
- 1203.0
Population outlook (Okaloosa County) Hauer SSP2
- Today (2025)
- 235,133 people
- By 2030
- 253,483 · +7.8%
- By 2040
- 289,537 · +23.1%
- By 2050
- 322,954 · +37.3%
- By 2075
- 399,624 · +70.0%
- By 2100
- 425,311 · +80.9%
Race, ethnicity, and origin ACS 2023
- Neighborhood character
- Diverse neighborhood (Simpson 0.60)
- Race & ethnicity
- White 59% Hispanic / Latino 19% Two or more races 14% Black 11% Asian 3%
- Hispanic origin (detail)
- Mexican 5% Puerto Rican 3% Dominican 1%
- Common ancestry
- Slovak 2% Lithuanian 2% Scotch-Irish 2%
- Foreign-born
- 15% · Canada, Vietnam, Jamaica
- Languages at home
- 81% English-only · Spanish 14% Other Indo-European 1% Vietnamese 1%
Political lean MEDSL · Okaloosa
- 2024 margin
- Solid R (+42.4) · D 28.2% · R 70.7% · Other 1.1%
- 2008→2024 swing
- +2.5pp toward D · 2008: -44.9pp · 2024: -42.4pp
- All cycles
- 2024: R+42.4 2020: R+39.1 2016: R+47.8 2012: R+49.4 2008: R+44.9
Not yet ingested
- Civics
- —
Market trends
- HPI YoY
- ▼ -111.28%
- Current HPI
- 268.6497
- Rent YoY
- ▼ -0.13%
- Metro
- Crestview-Fort Walton Beach-Destin, FL
- State GDP YoY
- ▲ 3.28%
- F500 in state
- 36
Industry mix (Fortune 500 HQ in FL)
| Industry | F500 HQs | Revenue |
|---|---|---|
| Industrial Technology | 2 | $29B |
|
||
| Insurance | 2 | $17B |
|
||
| Retail | 1 | $60B |
|
||
| Technology Distribution | 1 | $58B |
|
||
| Homebuilding | 1 | $35B |
|
||
| Technology Manufacturing | 1 | $35B |
|
||
Price history
-5.4% since first listed3 events — show timeline
- 2026-05-08 Pending — ECAR
- 2026-05-05 Price Changed $175,000 ECAR
- 2026-04-21 Listed $185,000 ECAR
Cash-flow waterfall
monthlySold comps — $/sqft
last 12 mo · ≤1 miLoading sold comps…