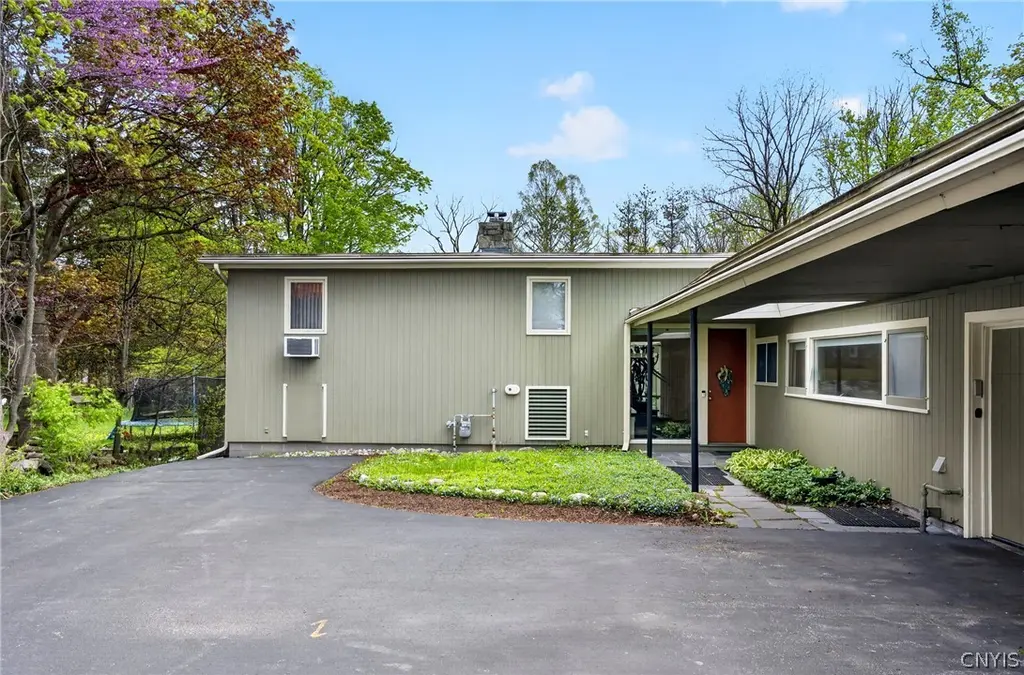
327 Kimber Rd
Syracuse, NY 13224
$399,000C
5 bd · 3.0 ba ·
2,811 sqft ·
Built 1951
· SingleFamily
· Pending
· 16 DOM
Cashflow @ list (25.0% down · 7.5%)
Estimated rent
$3,383/mo
Mortgage (P&I)
−$2,092
Tax + insurance
−$353
HOA
−$0
Vac / Maint / Mgmt
−$710
Net cashflow
$227/mo
Annual
$2,725/yr
Cap rate
6.98%
Cash-on-cash
2.44%
DSCR
1.11
1% rule
0.85%
Cash to close
$111,720
Investor read
- This is a 5-bed/3.0-bath single-family listed at $399k.
- At list price, monthly cash flow is $227 ($3k/yr) — positive.
- The deal already cash-flows at list — no discount required.
- To meet the 1% rule (rent ≥ 1% of price), the offer needs to be $338k (15.2% below list).
- It's been on market 16 days — a 2% lower offer ($393k) is reasonable based on typical stale-listing flexibility.
- Recommended offer: $338k (15.2% below list) — sets the bar for 1% rule.
- In year one you build about $32k of equity ($3k loan paydown + $29k appreciation (7.2% local appreciation)).
- Location reads 77/100 on livability (#187 in NY, #2,869 nationally) — a middle-class / working-renter tenant base. Strengths: amenities A+, commute A+, cost of living A+; Watch: schools D+, crime F, employment D-.
- Syracuse City School District (urban): math 18% / reading 26% proficiency, ranked #590 of 590 in NY (top 100%) — low school quality limits family demand, transient renter base, plan for 1-2y turnover; 74% free/reduced lunch — lower-income household profile, screen leases tightly.
- Watch-outs: built in 1951 — expect roof / HVAC / electrical / plumbing capex.
- Market conditions: 24 active listings in the ZIP; 2 comparable units currently listed for rent nearby; solid renter incomes; 616 units permitted in Onondaga County in 2024 (256 in 5+ unit buildings).
- Onondaga County population projected to shrink 9% by 2050 — rents likely to lag national; underwrite the cash flow, not the appreciation.
- Current owner paid $189k; list at $399k implies a 111% gain — meaningful room to come down on a strong offer.
- At projected returns (7.2% appreciation + 3.0% rent growth), your $112k cash investment doubles in ~3 years — after that, you're playing with house money.
- By year 2, paydown + projected appreciation supports a ~$50k cash-out refi (75% LTV) — recoverable capital for the next deal without selling this one.
- At $3,383/mo this rent would consume 53% of the median local household income ($76k/yr) (locally 423% of renters already pay >50% of income on rent) — very limited rent-growth headroom before tenants either downsize or default.
Questions for listing agent
- Built in 1951 — when were the roof, HVAC, electrical panel, plumbing, and water heater last replaced?
- Is there a deadline driving the sale (1031 exchange, divorce, estate, relocation)? That informs how much negotiation room exists.
- Schools are D-rated, which usually means shorter tenancies and higher turnover. Who's the typical renter profile here, and what's been the actual vacancy rate?
- Crime grade is F in this area — have there been break-ins, vandalism, or insurance claims at this property in the last 3 years? What carrier currently insures it and at what premium?
- What's the average days-on-market for RENTAL listings here right now (not sales)? A rising rental-DOM trend means longer vacancies and softer asking-rent achievability than the comps imply.
- What's the recent tenant-quality profile in this submarket — average credit score on applications, eviction rate, late-payment / NSF rate, and stable-employment percentage? A property-management company in the area should have these aggregated.
- How much new for-sale + rental construction is in the pipeline within 1–3 miles? Heavy new supply typically softens prices + rents 12–24 months out; constrained supply supports both.
CashFlowRE · CFR-YNQWS52RECCBMZ
· Data 3 weeks ago
cashflowre.app · 2026-05-29