327 Kimber Rd · Syracuse, NY
Flood risk 1/10 · Minimal
- FEMA flood zone
- X (unshaded)
- Chance of flooding over 30 yrs
- 0.0%
- Est. flood insurance / yr
- $473 – $860
Fire risk 1/10 · Minimal
- Est. fire insurance / yr
- $691 – $1,283
Heat risk 2/10 · Minimal
- Hot days now (above 96°F)
- 7 days/yr
- Hot days in 30 yrs
- 15 days/yr
Wind risk 1/10 · Minimal
- Chance of severe wind over 30 yrs
- 0.0%
Air-quality risk 2/10 · Minimal
- Unhealthy air days now
- 0 days/yr
- Unhealthy air days in 30 yrs
- 1 days/yr
Risk factors via First Street. Map © Google.
Why this score? — see what drove the C grade
The composite is a weighted blend of 9 inputs, each scored 0–100. Each bar is that input's sub-score; the figure is the points it added to the 100-point composite (weight × sub-score).
- Cash flow +16.4/30.0
- ARV discount +15.0/15.0
- Appreciation +8.6/10.0
- DSCR +5.1/10.0
- Livability +3.9/5.0
- 1% rule +3.5/10.0
- Rent growth +2.5/5.0
- Condition / age +2.5/5.0
- Schools +1.8/10.0
$399,000
🖨 Deal sheet 📄 Offer letter ✓ Due diligence
Listing remarks
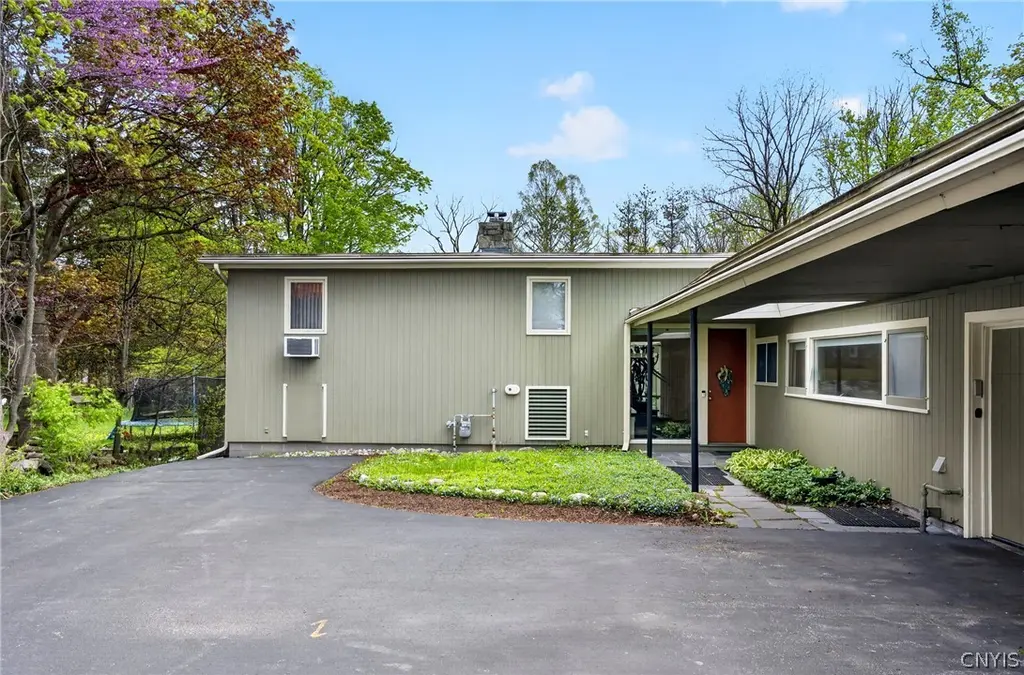
Originally built in 1951 and inspired by the timeless style of Frank Lloyd Wright, this well-maintained ranch/split-level home offers approximately 2,811 square feet, 5 bedrooms, and 3 full bathrooms, including a flexible suite ideal for a primary bedroom, in-law setup, or guest space, along with potential office areas throughout the home. Filled with natural light, this distinctive contemporary home features soaring ceilings, warm wood details, a dramatic floor-to-ceiling stone gas fireplace, and an open layout throughout. Set on an oversized, partially fenced lot with a peaceful, almost country-like setting in the city, the home offers exceptional indoor-outdoor connection with a lower-le
Key facts
- Attached garage
- Private gardens
- Carport
Tags
Property features AI
Exterior
- Parking: Attached garage with 2 spaces; Carport; Garage door opener; Driveway; Electricity to garage
- Utilities: Public water connected; Sewer connected; Cable available; High-speed internet available; Electric service with circuit breakers
- Home design: Single-story; Existing construction; Entry level main floor; Flat/membrane/rubber roof; Frame construction; Block foundation
- Construction: Built with frame construction; Block foundation; Flat/membrane/rubber roof
- Exterior features: Blacktop driveway; Balcony; Partial fencing; Shed(s)/storage; Near public transit; Rectangular lot
Interior
- Kitchen: Built-in range; Built-in oven; Electric cooktop; Electric oven; Electric range; Range hood; Dishwasher; Disposal; Refrigerator; Exhaust fan
- Bedrooms: 4 bedrooms on the main level
- Flooring: Carpet; Laminate; Tile; Varies
- Bathrooms: 3 full bathrooms total; 2 bathrooms on the main level
- Heating & cooling: Gas heating; Forced air; Hot water heating; Central air conditioning
- Interior features: Cathedral ceilings; Entrance foyer; Eat-in kitchen; Separate/formal living room; Great room; Home office; Living/dining room; Sliding glass doors; Skylights; Natural woodwork; In-law floorplan; Bath in primary bedroom; See remarks
- Laundry & utility: Washer; Dryer; Main-level laundry
Neighborhood map
What this means for you Summary
Snapshot
- This is a 5-bed/3.0-bath single-family listed at $399k.
Deal economics
- At list price, monthly cash flow is $227 ($3k/yr) — positive.
- The deal already cash-flows at list — no discount required.
- To meet the 1% rule (rent ≥ 1% of price), the offer needs to be $338k (15.2% below list).
- Recommended offer: $338k (15.2% below list) — sets the bar for 1% rule.
Location & tenants
- Location reads 77/100 on livability (#187 in NY, #2,869 nationally) — a middle-class / working-renter tenant base. Strengths: amenities A+, commute A+, cost of living A+; Watch: schools D+, crime F, employment D-.
- Syracuse City School District (urban): math 18% / reading 26% proficiency, ranked #590 of 590 in NY (top 100%) — low school quality limits family demand, transient renter base, plan for 1-2y turnover; 74% free/reduced lunch — lower-income household profile, screen leases tightly.
- Market conditions: 24 active listings in the ZIP; 2 comparable units currently listed for rent nearby; solid renter incomes; 616 units permitted in Onondaga County in 2024 (256 in 5+ unit buildings).
- At $3,383/mo this rent would consume 53% of the median local household income ($76k/yr) (locally 423% of renters already pay >50% of income on rent) — very limited rent-growth headroom before tenants either downsize or default.
Forward outlook
- In year one you build about $32k of equity ($3k loan paydown + $29k appreciation (7.2% local appreciation)).
- Onondaga County population projected to shrink 9% by 2050 — rents likely to lag national; underwrite the cash flow, not the appreciation.
- At projected returns (7.2% appreciation + 3.0% rent growth), your $112k cash investment doubles in ~3 years — after that, you're playing with house money.
- By year 2, paydown + projected appreciation supports a ~$50k cash-out refi (75% LTV) — recoverable capital for the next deal without selling this one.
Negotiation context
- It's been on market 16 days — a 2% lower offer ($393k) is reasonable based on typical stale-listing flexibility.
- Current owner paid $189k; list at $399k implies a 111% gain — meaningful room to come down on a strong offer.
Risks & watch-outs
- Watch-outs: built in 1951 — expect roof / HVAC / electrical / plumbing capex.
Questions for the listing agent
- Built in 1951 — when were the roof, HVAC, electrical panel, plumbing, and water heater last replaced?
- Is there a deadline driving the sale (1031 exchange, divorce, estate, relocation)? That informs how much negotiation room exists.
- Schools are D-rated, which usually means shorter tenancies and higher turnover. Who's the typical renter profile here, and what's been the actual vacancy rate?
- Crime grade is F in this area — have there been break-ins, vandalism, or insurance claims at this property in the last 3 years? What carrier currently insures it and at what premium?
- What's the average days-on-market for RENTAL listings here right now (not sales)? A rising rental-DOM trend means longer vacancies and softer asking-rent achievability than the comps imply.
- What's the recent tenant-quality profile in this submarket — average credit score on applications, eviction rate, late-payment / NSF rate, and stable-employment percentage? A property-management company in the area should have these aggregated.
- How much new for-sale + rental construction is in the pipeline within 1–3 miles? Heavy new supply typically softens prices + rents 12–24 months out; constrained supply supports both.
Investment metrics
- 1% rule
- 0.85% ✗
- Cap rate
- 6.98%
- Cash-on-cash
- 2.44%
- DSCR
- 1.11
- GRM
- 9.8
CMA / ARV
- ARV (median comp)
- $479,960
- List price
- $399,000
- Delta
- -16.87%
- Verdict
- UNDERPRICED
- Comps
- 20 within 1.0 mi
Show comp detail 12 sales within ~0.75 mi
| Address | Dist | Beds/Ba | Sqft | Sold | Price | $/sf | Match |
|---|---|---|---|---|---|---|---|
| 220 Locksley Rd | 0.18mi | 4/2.0 (-1) | 2,900 (+3%) | 18mo | $352,000 | $121 | 62 |
| 1904 Euclid Ave | 0.51mi | 5/3.5 | 2,704 (-4%) | 10mo | $510,000 | $189 | 60 |
| 107 Manderson Rd | 0.50mi | 4/3.0 (-1) | 2,981 (+6%) | 6mo | $650,000 | $218 | 56 |
| 308 Bradford Pkwy | 0.53mi | 5/3.0 | 2,950 (+5%) | 14mo | $445,000 | $151 | 55 |
| 516 Standish Dr | 0.63mi | 4/2.5 (-1) | 2,934 (+4%) | 4mo | $477,000 | $163 | 53 |
| 204 Old Lyme Rd Rd | 0.64mi | 4/3.0 (-1) | 2,724 (-3%) | 9mo | $623,000 | $229 | 52 |
| 104 Old Lyme Rd | 0.74mi | 4/2.5 (-1) | 2,960 (+5%) | 1mo | $490,000 | $166 | 49 |
| 503 Standish Dr | 0.59mi | 6/3.0 (+1) | 3,004 (+7%) | 12mo | $451,000 | $150 | 46 |
| 116 Shirley Rd | 0.58mi | 5/3.0 | 2,506 (-11%) | 10mo | $500,000 | $200 | 46 |
| 507 Scott Ave | 0.71mi | 5/2.5 | 2,486 (-12%) | 6mo | $310,000 | $125 | 41 |
| 151 Edgehill Rd | 0.73mi | 4/1.5 (-1) | 3,080 (+10%) | 5mo | $320,000 | $104 | 34 |
| 5270 Wethersfield Rd | 0.72mi | 4/2.5 (-1) | 3,076 (+9%) | 12mo | $510,000 | $166 | 34 |
Match score weights: distance 35% · size 25% · config 20% · recency 20%. Top-matched comps best support the ARV.
Projected returns pro-forma
7.21% appreciation · 3.0% rent growth · sell at horizon
- IRR
- 20.1%
- Equity multiple
- 2.42×
- Total profit
- $158,797
- Equity at exit
- $281,968
- IRR
- 18.9%
- Equity multiple
- 5.03×
- Total profit
- $450,003
- Equity at exit
- $540,641
Cash invested: $111,720 (down + closing). Projections, not guarantees.
Landlord ↔ Tenant lean methodology
- Overall (STATE)
- 15 Strongly Tenant-Friendly
- State New York
- 15 Strongly Tenant-Friendly · D+10
- County
- — inherits STATE
- City
- — inherits STATE
ZIP-level market 13224
- Home prices YoY
- 2.1%
- Active inventory
- 24
- Price-to-rent
- 9.8×
Monthly cashflow live
- Estimated rent
- $3,383 medium interval (Pro) →
- Mortgage (P&I)
- −$2,092
- Tax from tax record
- −$187 /mo · $2,243/yr
- Insurance
- −$166
- HOA
- −$0
- Vacancy / Maint / Mgmt
- −$710
- Net cashflow
- $227
Break-even live
UW: 25.0% down · 7.5% · 30yr · 1.5% tax · 5.0% vac · 8.0% maint · 8.0% mgmt
Financing live
Cash to close
- Down payment
- $99,750
- Closing costs
- $11,970
- Reserves months
- —
- Total cash needed
- —
Loan-product check · same deal, 3 products live
Conventional
25% down · 7.5% · 30yr
- Down + closing
- —
- Monthly P&I
- —
- Monthly cashflow
- —
- DSCR
- —
- Eligible?
- —
Personal DTI + credit; lowest rate.
DSCR
20% down · 8.5% · 30yr
- Down + closing
- —
- Monthly P&I
- —
- Monthly cashflow
- —
- DSCR
- —
- Eligible?
- —
No personal income docs; deal must DSCR.
Hard money
10% down · 12.0% · 12mo
- Down + closing
- —
- Monthly P&I
- —
- Monthly cashflow
- —
- DSCR
- —
- Eligible?
- —
Short-term bridge; refi at stabilization.
Rent comps 2 comps
| Address | Beds | Baths | Sqft | Rent | $/sqft | DOM | Units | Dist |
|---|---|---|---|---|---|---|---|---|
| 215 Locksley Rd Syracuse, NY | 4.0 | 3.5 | 2352 | $4,300 | $1.83 | 13d | 1 | 0.15mi |
| 750 Euclid Ave Syracuse, NY | 5.0 | 2.0 | 2736 | $4,100 | $1.50 | 43d | 1 | 1.42mi |
Listing history 3 events
-
2026-05-11historical Active Under Contract 1380-char remark
-
2026-05-06$399,000 Active 1380-char remark
-
2005-09-23soldstatus $189,000
ⓘ Source: listings_history table (triggers on properties + properties_extension) + one-shot
backfill from property_details.listing_events for pre-trigger history.
Tax reassessment forecast NY · Partial reset (capped growth)
- Current annual tax
- $2,243 · $187/mo
- Projected year-2 tax
- $4,493 · $374/mo
- Expected delta
- +$2,250/yr (+$187/mo · 100.3%)
ⓘ Screening estimate from a state-policy table — verify with the county assessor before closing.
Climate risk First Street
- Flood 1/10 Low FEMA zone X (unshaded) · 0% chance over 30 yrs
- Wildfire 1/10 Low
- Heat 2/10 Low 7 d/yr ≥96°F today · 15 d/yr by 30 yrs out
- Wind 1/10 Low 0% chance of damaging wind over 30 yrs
- Air quality 2/10 Low 0 unhealthy d/yr today · 1 by 30 yrs out
Nearby sold comps map
Loading sold comps map…
Walkable amenities ~0.75 mi
Loading nearby amenities…
Taxation est. · year 1
- Rental income
- $40,598
- − Mortgage interest
- −$22,350
- − Property taxes
- −$2,243
- − Insurance
- −$1,995
- − Repairs & maintenance
- −$3,248
- − Management
- −$3,248
- − Depreciation
- −$11,607
- Taxable loss
- −$4,093
- Est. tax savings @ 24.0%
- +$982
- After-tax cash flow
- $3,708/yr
For passive investors: Depreciation is non-cash, so a rental often shows a tax loss while cash-flowing — sheltering income. Rental losses are passive: they offset passive income freely, and up to $25,000/yr can offset ordinary (W-2) income if you actively participate and your MAGI is under $100k (phasing out to $0 by $150k); unused losses carry forward. On sale, claimed depreciation is recaptured at up to 25%, and gains may owe capital-gains tax (a 1031 exchange can defer both). Figures are a year-1 estimate at your 24.0% rate — not tax advice; consult a CPA.
Schools (NCES district)
- District
- Syracuse City School District
- NCES district ID
- 3628590
- Math proficiency
- 18% ▼ -5.00%
- Reading proficiency
- 26% ▬ 0.00%
- Median HH income
- $32,097
- Composite
- 17.83/100
- National rank
- #9007
- State rank
- #590 of 590 in NY
Livability — Syracuse
- Score
- 77/100
- State rank
- #187
- US rank
- #2869
Category grades
Schools grade is shown separately in the Schools card above.
Census & demographics
- Census place
- Syracuse, NY
- County
- Onondaga County · 247,257 people
- City population
- 152,627
- Metro
- Syracuse, NY
- Population (ZIP)
- 8,659
- Household income
- $76,500
- Rent vs Own
- Severe rent burden
- 423.0
Population outlook (Onondaga County) Hauer SSP2
- Today (2025)
- 467,894 people
- By 2030
- 463,381 · -1.0%
- By 2040
- 447,697 · -4.3%
- By 2050
- 426,399 · -8.9%
- By 2075
- 373,661 · -20.1%
- By 2100
- 307,967 · -34.2%
Race, ethnicity, and origin ACS 2023
- Neighborhood character
- Diverse neighborhood (Simpson 0.67)
- Race & ethnicity
- White 47% Black 32% Two or more races 10% Hispanic / Latino 8% Asian 6%
- Hispanic origin (detail)
- Puerto Rican 3% Cuban 1% Dominican 2%
- Common ancestry
- Romanian 3% Arab 2% Subsaharan African 2%
- Foreign-born
- 16% · Canada, China, Jamaica
- Languages at home
- 84% English-only · Spanish 6% Arabic 4% Other Indo-European 2%
Political lean MEDSL · Onondaga
- 2024 margin
- D (+17.3) · D 58.6% · R 41.4%
- 2008→2024 swing
- -3.0pp toward R · 2008: 20.3pp · 2024: 17.3pp
- All cycles
- 2024: D+17.3 2020: D+20.6 2016: D+12.8 2012: D+21.1 2008: D+20.3
Not yet ingested
- Civics
- —
Market trends
- HPI YoY
- ▲ 7.21%
- Current HPI
- 350.9419
- Rent YoY
- —
- Metro
- Syracuse, NY
- State GDP YoY
- ▲ 2.60%
- F500 in state
- 92
Industry mix (Fortune 500 HQ in NY)
| Industry | F500 HQs | Revenue |
|---|---|---|
| Financial Services | 10 | $950B |
|
||
| Consumer Goods | 9 | $162B |
|
||
| Insurance | 4 | $225B |
|
||
| Telecommunications | 2 | $144B |
|
||
| Pharmaceuticals | 2 | $112B |
|
||
| Media / Entertainment | 2 | $69B |
|
||
Price history
+111.1% since first listed4 events — show timeline
- 2026-05-22 Pending — CNYIS
- 2026-05-11 Contingent — CNYIS
- 2026-05-06 Listed $399,000 CNYIS
- 2005-09-23 Sold (Public Records) $189,000 Public Records
Property tax history
+0.4%/yrLatest (2025): $2,243 · -2.2% YoY. Source: county tax records.
Cash-flow waterfall
monthlySold comps — $/sqft
last 12 mo · ≤1 miLoading sold comps…