1660 E Main St
Lancaster, OH 43130
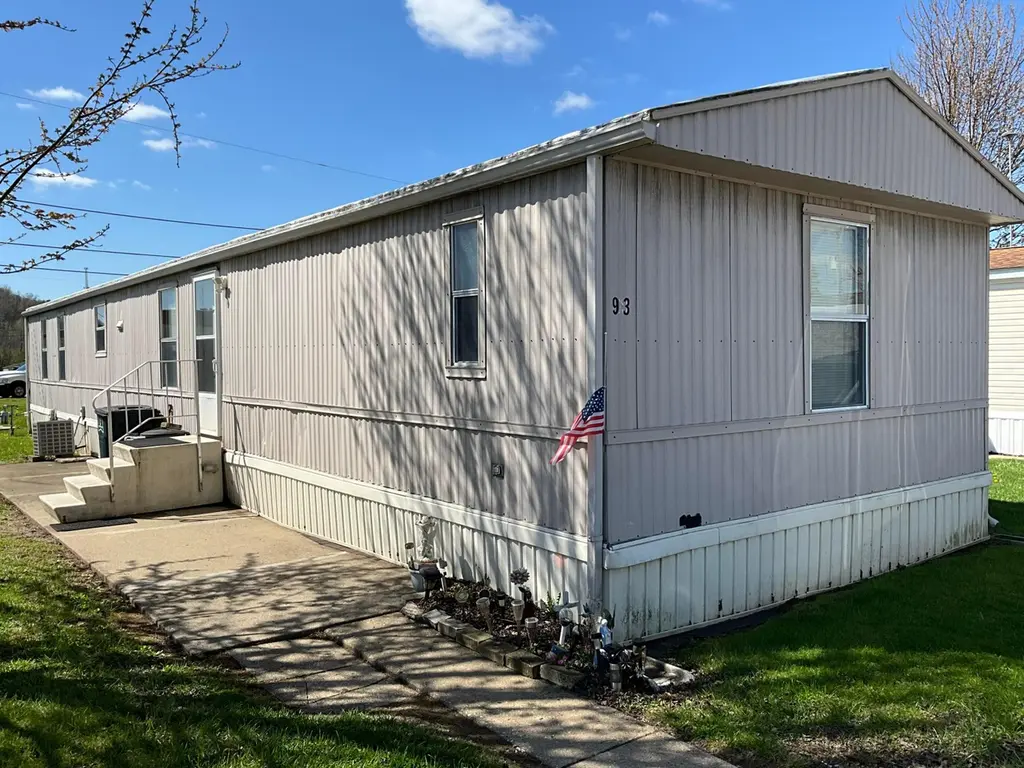
$40,000C
1 bd · 1.0 ba ·
504 sqft ·
Built 1993
· SingleFamily
· Active
· 66 DOM
Cashflow @ list (25.0% down · 7.5%)
Estimated rent
$993/mo
Mortgage (P&I)
−$210
Tax + insurance
−$144
HOA
−$390
Vac / Maint / Mgmt
−$209
Net cashflow
$41/mo
Annual
$487/yr
Cap rate
7.51%
Cash-on-cash
4.35%
DSCR
1.19
1% rule
2.48%
Cash to close
$11,200
Investor read
- This is a 1-bed/1.0-bath single-family listed at $40k.
- At list price, monthly cash flow is $41 ($487/yr) — positive.
- The deal already cash-flows at list — no discount required.
- Meets the 1% rule at list price ($993 rent vs $40k).
- It's been on market 66 days — a 6% lower offer ($38k) is reasonable based on typical stale-listing flexibility.
- Recommended offer: $38k (6.0% below list) — sets the bar for market timing.
- Local home prices are declining (-3.0%/yr); year-one equity from $277 of loan paydown is wiped out by about $1k of value loss. Plan a longer hold.
- Location reads 86/100 on livability (#41 in OH, #423 nationally) — a professional / high-income tenant draw. Strengths: amenities A+, cost of living A+, housing A+; Watch: crime D, employment D.
- Lancaster City (town): math 38% / reading 51% proficiency, ranked #504 of 656 in OH (top 77%) — families likely to look elsewhere, expect single-tenant / working-renter base with shorter leases.
- Watch-outs: property tax is 3.8% of price; HOA is 39% of rent.
- Market conditions: Rents rising fast (+5.2%/yr); 204 active listings in the ZIP; 2 comparable units currently listed for rent nearby; 475 units permitted in Fairfield County in 2024 (0 in 5+ unit buildings).
- Fairfield County population projected at +8% by 2050 — modest demand growth; plan on rents tracking national, not racing it.
- 15 sale attempts since 30y ago with the ask held roughly flat each time — persistent listings suggest the price (not the market) is what's stuck; bring a comps-based counter.
- Current owner paid $20k; list at $40k implies a 105% gain — meaningful room to come down on a strong offer.
- At projected returns (-3.0% appreciation + 5.2% rent growth), your $11k cash investment doubles in ~9 years — after that, you're playing with house money.
- Cap rate 7.5% vs local median 4.0% in Lancaster — top-decile yield for the area; either an underpriced asset or a hidden risk that comps aren't pricing in. Stress-test before assuming the spread holds.
- This rent is only 17% of the median local income ($72k/yr) — well below the 30% rent-burden line; pricing power to push rent on renewal without tenant pushback.
Questions for listing agent
- It's been on market 66 days. Have you received any prior offers? Is the seller open to a 6% concession, seller financing, or rate buy-down credit?
- Property tax is high relative to price — has the assessment been appealed recently, and will the sale trigger a re-assessment?
- What does the HOA fee cover, when was the last increase, and are there any pending special assessments or reserve-fund shortfalls?
- Why hasn't it sold? Are there any deal-killer items the seller is aware of (foundation, flood, title, zoning, code violations)?
- Is there a deadline driving the sale (1031 exchange, divorce, estate, relocation)? That informs how much negotiation room exists.
- Crime grade is D in this area — have there been break-ins, vandalism, or insurance claims at this property in the last 3 years? What carrier currently insures it and at what premium?
- What's the average days-on-market for RENTAL listings here right now (not sales)? A rising rental-DOM trend means longer vacancies and softer asking-rent achievability than the comps imply.
- What's the recent tenant-quality profile in this submarket — average credit score on applications, eviction rate, late-payment / NSF rate, and stable-employment percentage? A property-management company in the area should have these aggregated.
CashFlowRE · CFR-YP4RDVEGDYF3JW
· Data 2 days ago
cashflowre.app · 2026-05-29