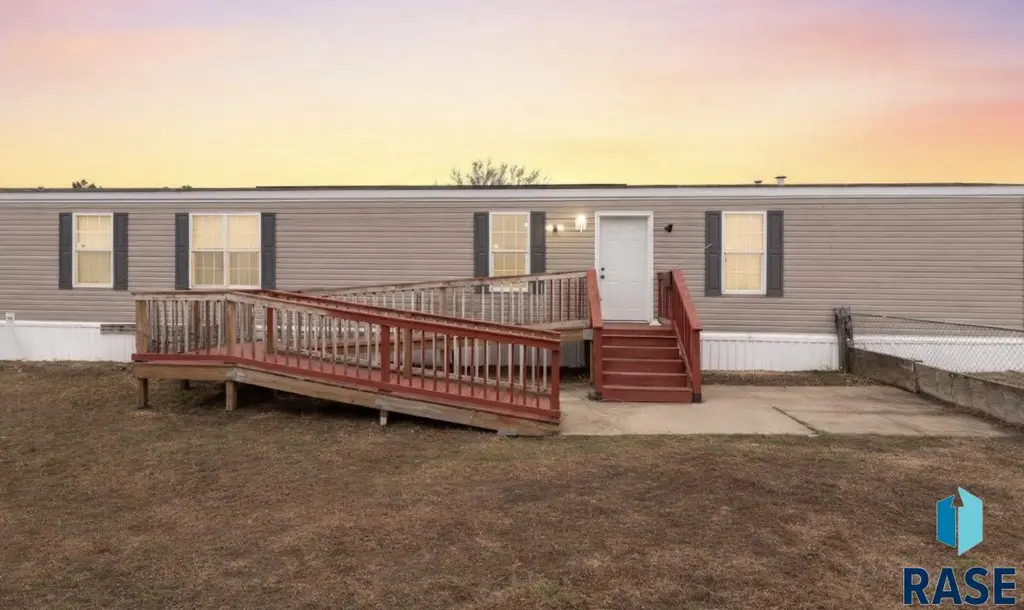
6013 W Flamingo Pl Pl
Sioux Falls, SD 57107
$48,000F
3 bd · 4.0 ba ·
1,216 sqft ·
Built 2015
· Manufactured
· Pending
· 14 DOM
Cashflow @ list (25.0% down · 7.5%)
Estimated rent
$1,301/mo
Mortgage (P&I)
−$252
Tax + insurance
−$54
HOA
−$850
Vac / Maint / Mgmt
−$273
Net cashflow
$-128/mo
Annual
$-1,540/yr
Cap rate
3.08%
Cash-on-cash
-11.46%
DSCR
0.49
1% rule
2.71%
Cash to close
$13,440
Investor read
- This is a 3-bed/4.0-bath manufactured listed at $48k.
- At list price, monthly cash flow is $-128 ($-2k/yr) — negative.
- To cash-flow at today's rent, offer at most $25k (47.2% below list).
- Meets the 1% rule at list price ($1k rent vs $48k).
- Only 14 days on market — expect competitive offers; lowballing is unlikely to land.
- Recommended offer: $25k (47.2% below list) — sets the bar for cash-flow.
- Local home prices are declining (-3.0%/yr); year-one equity from $332 of loan paydown is wiped out by about $1k of value loss. Plan a longer hold.
- Location reads 85/100 on livability (#3 in SD, #610 nationally) — a professional / high-income tenant draw. Strengths: amenities A+, commute A+, cost of living A+; Watch: crime F.
- Sioux Falls School District 49-5 (urban): math 39% / reading 48% proficiency, ranked #45 of 59 in SD (top 76%) — families likely to look elsewhere, expect single-tenant / working-renter base with shorter leases.
- Zoned schools: Hayward Elementary - 38 (math 19% / reading 19%, grade F, #237 of 253 statewide, top 94%, 652 students, 70% FRL); George Mcgovern Middle School -09 (math 11% / reading 22%, grade F, #138 of 143 statewide, top 96%, 719 students, 59% FRL); Jefferson High School - 67 (1,749 students, 34% FRL) — zoned schools average 54% FRL vs 36% district-wide (18 pts higher); higher-poverty schools than district average — tighter screening recommended.
- Zoned-school proficiency averages 18% at this address vs 44% district-wide (-26 pts) — the specific schools serving this property underperform the Sioux Falls School District 49-5 average; the district grade overstates school quality for this exact location.
- Watch-outs: HOA is 65% of rent.
- Market conditions: 146 active listings in the ZIP; 16 comparable units currently listed for rent nearby; rentals at typical pace (median 23d on market — plan ~3-4 weeks tenant-placement turnaround); 2,425 units permitted in Minnehaha County in 2024 (1,367 in 5+ unit buildings).
- Minnehaha County population projected at +46% by 2050 — long-run rental-demand tailwind backs the buy-and-hold thesis.
- 2 sale attempts; this cycle's ask has dropped $5k (9%) from the opening price — seller is motivated, your offer sets the floor, not the list.
Questions for listing agent
- What do current leases actually rent for vs. the listed asking? Can we see a recent rent roll and the last 12 months of T-12 income?
- What does the HOA fee cover, when was the last increase, and are there any pending special assessments or reserve-fund shortfalls?
- Is there a deadline driving the sale (1031 exchange, divorce, estate, relocation)? That informs how much negotiation room exists.
- Schools are B-rated — typically a magnet for longer-tenancy family renters. What's the average tenant stay here, and is there a school-zone premium baked into asking?
- Crime grade is F in this area — have there been break-ins, vandalism, or insurance claims at this property in the last 3 years? What carrier currently insures it and at what premium?
- The area grade is low — what's the realistic commute time and amenity access for the typical tenant pool here? Any planned neighborhood developments (good or bad) we should know about?
- What's the average days-on-market for RENTAL listings here right now (not sales)? A rising rental-DOM trend means longer vacancies and softer asking-rent achievability than the comps imply.
- What's the recent tenant-quality profile in this submarket — average credit score on applications, eviction rate, late-payment / NSF rate, and stable-employment percentage? A property-management company in the area should have these aggregated.
CashFlowRE · CFR-YP6KYT8FHWRHJG
· Data 4 weeks ago
cashflowre.app · 2026-05-29