6013 W Flamingo Pl Pl · Sioux Falls, SD
Flood risk 1/10 · Minimal
- FEMA flood zone
- X (unshaded)
- Chance of flooding over 30 yrs
- 0.0%
- Est. flood insurance / yr
- $473 – $860
Fire risk 3/10 · Minor
- Est. fire insurance / yr
- $1,342 – $2,492
Heat risk 2/10 · Minimal
- Hot days now (above 99°F)
- 7 days/yr
- Hot days in 30 yrs
- 14 days/yr
Wind risk 2/10 · Minimal
- Chance of severe wind over 30 yrs
- —
Air-quality risk 2/10 · Minimal
- Unhealthy air days now
- 1 days/yr
- Unhealthy air days in 30 yrs
- 1 days/yr
Risk factors via First Street. Map © Google.
Why this score? — see what drove the F grade
The composite is a weighted blend of 9 inputs, each scored 0–100. Each bar is that input's sub-score; the figure is the points it added to the 100-point composite (weight × sub-score).
- 1% rule +10.0/10.0
- ARV discount +4.5/15.0
- Cash flow +4.3/30.0
- Livability +4.2/5.0
- Schools +3.7/10.0
- Rent growth +2.5/5.0
- Condition / age +2.5/5.0
- DSCR +0.0/10.0
- Appreciation +0.0/10.0
$48,000
🖨 Deal sheet (PDF) 📄 Offer letter ✓ Due diligence
Key facts
- Large center island
- Private bath
- Open layout
Tags
Property features AI
Finance
- Other: Land is owned
- HOA & community: Homeowners association present; HOA covers trash, snow removal, road maintenance and water; Association fee approximately $850 (period not specified)
Exterior
- Parking: Road access via private maintained asphalt road
- Utilities: Public water; Public sewer; Electric service (standard)
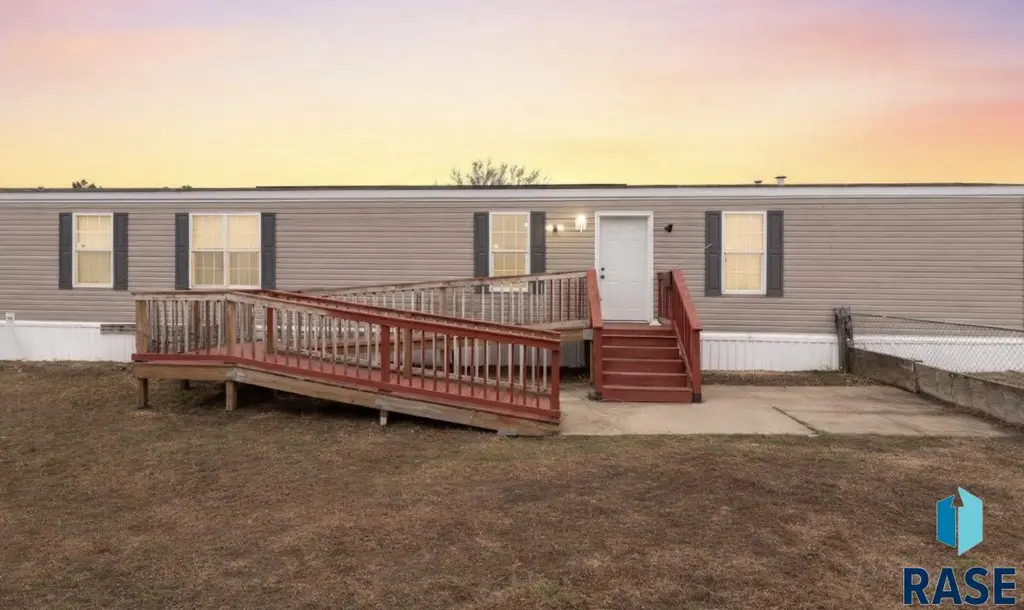
- Home design: Mobile home; Ranch style; Single-story (ranch); Main entry has a ramp for accessibility; Above-grade finished area approximately 1,216
- Construction: Vinyl siding; Composition roof; Other type foundation
- Exterior features: Chain link fencing; Shed(s) on the property; Irregular-shaped lot
Interior
- Kitchen: Range; Dishwasher; Refrigerator; Stove hood
- Bedrooms: Primary suite/main bedroom on the main level
- Flooring: Carpet; Vinyl
- Bathrooms: 1 full bathroom and 1 three-quarter bathroom; Main level includes 1 full bath and the primary bathroom
- Heating & cooling: Natural gas heating; Central air conditioning; One water heater
- Interior features: Master bedroom on the main level; Three or more bedrooms on the same level; 8 total rooms; No basement
- Laundry & utility: No water softener specified
Neighborhood map
What this means for you Summary
Snapshot
- This is a 3-bed/4.0-bath manufactured listed at $48k.
Deal economics
- At list price, monthly cash flow is $-128 ($-2k/yr) — negative.
- To cash-flow at today's rent, offer at most $25k (47.2% below list).
- Meets the 1% rule at list price ($1k rent vs $48k).
- Recommended offer: $25k (47.2% below list) — sets the bar for cash-flow.
Location & tenants
- Location reads 85/100 on livability (#3 in SD, #610 nationally) — a professional / high-income tenant draw. Strengths: amenities A+, commute A+, cost of living A+; Watch: crime F.
- Sioux Falls School District 49-5 (urban): math 39% / reading 48% proficiency, ranked #45 of 59 in SD (top 76%) — families likely to look elsewhere, expect single-tenant / working-renter base with shorter leases.
- Zoned schools: Hayward Elementary - 38 (math 19% / reading 19%, grade F, #237 of 253 statewide, top 94%, 652 students, 70% FRL); George Mcgovern Middle School -09 (math 11% / reading 22%, grade F, #138 of 143 statewide, top 96%, 719 students, 59% FRL); Jefferson High School - 67 (1,749 students, 34% FRL) — zoned schools average 54% FRL vs 36% district-wide (18 pts higher); higher-poverty schools than district average — tighter screening recommended.
- Zoned-school proficiency averages 18% at this address vs 44% district-wide (-26 pts) — the specific schools serving this property underperform the Sioux Falls School District 49-5 average; the district grade overstates school quality for this exact location.
- Market conditions: 146 active listings in the ZIP; 16 comparable units currently listed for rent nearby; rentals at typical pace (median 23d on market — plan ~3-4 weeks tenant-placement turnaround); 2,425 units permitted in Minnehaha County in 2024 (1,367 in 5+ unit buildings).
Forward outlook
- Local home prices are declining (-3.0%/yr); year-one equity from $332 of loan paydown is wiped out by about $1k of value loss. Plan a longer hold.
- Minnehaha County population projected at +46% by 2050 — long-run rental-demand tailwind backs the buy-and-hold thesis.
Negotiation context
- Only 14 days on market — expect competitive offers; lowballing is unlikely to land.
- 2 sale attempts; this cycle's ask has dropped $5k (9%) from the opening price — seller is motivated, your offer sets the floor, not the list.
Risks & watch-outs
- Watch-outs: HOA is 65% of rent.
Questions for the listing agent
- What do current leases actually rent for vs. the listed asking? Can we see a recent rent roll and the last 12 months of T-12 income?
- What does the HOA fee cover, when was the last increase, and are there any pending special assessments or reserve-fund shortfalls?
- Is there a deadline driving the sale (1031 exchange, divorce, estate, relocation)? That informs how much negotiation room exists.
- Schools are B-rated — typically a magnet for longer-tenancy family renters. What's the average tenant stay here, and is there a school-zone premium baked into asking?
- Crime grade is F in this area — have there been break-ins, vandalism, or insurance claims at this property in the last 3 years? What carrier currently insures it and at what premium?
- The area grade is low — what's the realistic commute time and amenity access for the typical tenant pool here? Any planned neighborhood developments (good or bad) we should know about?
- What's the average days-on-market for RENTAL listings here right now (not sales)? A rising rental-DOM trend means longer vacancies and softer asking-rent achievability than the comps imply.
- What's the recent tenant-quality profile in this submarket — average credit score on applications, eviction rate, late-payment / NSF rate, and stable-employment percentage? A property-management company in the area should have these aggregated.
- How much new for-sale + rental construction is in the pipeline within 1–3 miles? Heavy new supply typically softens prices + rents 12–24 months out; constrained supply supports both.
Investment metrics
- 1% rule
- 2.71% ✓
- Cap rate
- 3.08%
- Cash-on-cash
- -11.46%
- DSCR
- 0.49
- GRM
- 3.1
CMA / ARV
- ARV (median comp)
- $45,000
- List price
- $48,000
- Delta
- 6.67%
- Verdict
- FAIR
- Comps
- 15 within 1.0 mi
Show comp detail 12 sales within ~0.75 mi
| Address | Dist | Beds/Ba | Sqft | Sold | Price | $/sf | Match |
|---|---|---|---|---|---|---|---|
| 6304 W Sandalwood Pl Pl | 0.16mi | 3/2.0 | 1,216 (0%) | 8mo | $104,900 | $86 | 78 |
| 812 N Teal Pl Pl | 0.33mi | 3/2.5 | 1,216 (0%) | 9mo | $25,000 | $21 | 71 |
| 300 N Dogwood Pl | 0.22mi | 3/2.0 | 1,190 (-2%) | 14mo | $20,000 | $17 | 66 |
| 103 N Cheers Pl | 0.24mi | 3/2.0 | 1,144 (-6%) | 10mo | $30,000 | $26 | 63 |
| 806 N Doland Pl | 0.50mi | 3/2.0 | 1,216 (0%) | 10mo | $20,000 | $16 | 60 |
| 909 N Irene Pl | 0.49mi | 3/2.0 | 1,216 (0%) | 12mo | $59,225 | $49 | 59 |
| 909 N Scotland Pl Pl | 0.52mi | 2/2.0 (-1) | 1,216 (0%) | 8mo | $30,000 | $25 | 56 |
| 5809 W Wren Pl Pl | 0.22mi | 3/2.0 | 1,040 (-14%) | 2mo | $45,000 | $43 | 56 |
| 603 N Tonya Pl | 0.61mi | 3/2.0 | 1,216 (0%) | 10mo | $47,000 | $39 | 55 |
| 600 N Swan Pl Pl | 0.38mi | 3/2.0 | 1,344 (+10%) | 2mo | $79,900 | $59 | 55 |
| 6309 W Grove Pl | 0.16mi | 3/1.5 | 1,088 (-10%) | 15mo | $27,900 | $26 | 53 |
| 901 Mallard Pl | 0.44mi | 3/1.0 | 1,128 (-7%) | 17mo | $55,000 | $49 | 42 |
Match score weights: distance 35% · size 25% · config 20% · recency 20%. Top-matched comps best support the ARV.
Projected returns pro-forma
-3.0% appreciation · 3.0% rent growth · sell at horizon
- IRR
- -35.2%
- Equity multiple
- -0.15×
- Total profit
- $-15,427
- Equity at exit
- $7,157
- IRR
- -36.5%
- Equity multiple
- -0.62×
- Total profit
- $-21,824
- Equity at exit
- $4,150
Cash invested: $13,440 (down + closing). Projections, not guarantees.
Landlord ↔ Tenant lean methodology
- Overall (STATE)
- 83 Strongly Landlord-Friendly
- State South Dakota
- 83 Strongly Landlord-Friendly · R+16
- County
- — inherits STATE
- City
- — inherits STATE
ZIP-level market 57107
- Home prices YoY
- -21.6%
- Active inventory
- 146
- Price-to-rent
- 3.1×
Monthly cashflow live
- Estimated rent
- $1,301 high interval (Pro) →
- Mortgage (P&I)
- −$252
- Tax from tax record
- −$34 /mo · $410/yr
- Insurance
- −$20
- HOA
- −$850
- Vacancy / Maint / Mgmt
- −$273
- Net cashflow
- $-128
Break-even live
Sensitivity live
| Price | -10% $-101 | -5% $-115 | +0% $-128 | +5% $-142 | +10% $-156 |
|---|---|---|---|---|---|
| Rent | -10% $-231 | -5% $-180 | +0% $-128 | +5% $-77 | +10% $-26 |
| Rate | -1.0pp $-104 | -0.5pp $-116 | base $-128 | +0.5pp $-141 | +1.0pp $-153 |
UW: 25.0% down · 7.5% · 30yr · 1.5% tax · 5.0% vac · 8.0% maint · 8.0% mgmt
Financing live
Cash to close
- Down payment
- $12,000
- Closing costs
- $1,440
- Reserves months
- —
- Total cash needed
- —
Loan-product check · same deal, 3 products live
Conventional
25% down · 7.5% · 30yr
- Down + closing
- —
- Monthly P&I
- —
- Monthly cashflow
- —
- DSCR
- —
- Eligible?
- —
Personal DTI + credit; lowest rate.
DSCR
20% down · 8.5% · 30yr
- Down + closing
- —
- Monthly P&I
- —
- Monthly cashflow
- —
- DSCR
- —
- Eligible?
- —
No personal income docs; deal must DSCR.
Hard money
10% down · 12.0% · 12mo
- Down + closing
- —
- Monthly P&I
- —
- Monthly cashflow
- —
- DSCR
- —
- Eligible?
- —
Short-term bridge; refi at stabilization.
Rent comps 16 comps
| Address | Beds | Baths | Sqft | Rent | $/sqft | DOM | Units | Dist |
|---|---|---|---|---|---|---|---|---|
| 5317 W Pineridge Dr Sioux Falls, SD | 3.0 | 1.0–2.0 | 872 | $1,365 | $1.56 | 15d | 15 | 0.78mi |
| 500 S Ruth Ave Sioux Falls, SD | 3.0 | 2.0 | 1100 | $1,301 | $1.18 | 15d | 1 | 0.92mi |
| 912 S Willow Creek Pl Sioux Falls, SD | 1.0–2.0 | 1.0–2.0 | 868 | $1,482 | $1.71 | 15d | 4 | 0.96mi |
| 912 Willow Creek Pl Unit 928-10 Sioux Falls, SD | 2.0 | 2.0 | 1086 | $1,294 | $1.19 | 23d | 1 | 0.96mi |
| 5811 W Christopher Pl Unit 15 Sioux Falls, SD | 2.0 | 2.0 | 1100 | $1,095 | $1.00 | 45d | 1 | 1.01mi |
| 5811 W Christopher Pl Unit 02 Sioux Falls, SD | 2.0 | 1.0 | 1010 | $900 | $0.89 | 45d | 1 | 1.01mi |
| 5801 W Christopher Pl Sioux Falls, SD | 2.0–3.0 | 1.0 | 989 | $1,047 | $1.06 | 23d | 3 | 1.03mi |
| 920 Willow Creek Pl Unit 920-14 Sioux Falls, SD | 2.0 | 2.0 | 1086 | $1,250 | $1.15 | 23d | 1 | 1.03mi |
| 1123 S Bridgeport Pl Sioux Falls, SD | 2.0 | 1.5 | 1224 | $1,275 | $1.04 | 45d | 1 | 1.05mi |
| 1125 S Ebenezer Ave Sioux Falls, SD | 1.0–2.0 | 1.0–2.0 | 936 | $1,370 | $1.46 | 15d | 10 | 1.23mi |
| 1402 S Marion Rd Sioux Falls, SD | 1.0–3.0 | 1.0–2.0 | 1034 | $1,220 | $1.18 | 15d | 1 | 1.36mi |
| 701 S Lyons Ave Sioux Falls, SD | 3.0 | 2.0 | 1100 | $1,005 | $0.91 | 45d | 1 | 1.38mi |
| 2316 N Valley View Rd Sioux Falls, SD | 1.0–2.0 | 1.0–2.0 | 800 | $1,225 | $1.53 | 15d | 35 | 1.40mi |
| 1111 S Sertoma Ave Sioux Falls, SD | 1.0–2.0 | 1.0–2.0 | 797 | $1,115 | $1.40 | 15d | 11 | 1.41mi |
| 925 S Newcomb Ave Unit 18 Sioux Falls, SD | 2.0 | 1.0 | 900 | $950 | $1.06 | 23d | 1 | 1.48mi |
| 925 S Newcomb Ave Apt 12 Sioux Falls, SD | 2.0 | 1.0 | 890 | $950 | $1.07 | 45d | 1 | 1.48mi |
HOA detail
- Monthly dues
- $850 · $10,200/yr
Listing history 6 events
-
2026-05-12status Pending 781-char remark
-
2026-05-06price $48,000 781-char remark
-
2026-04-28$53,000 Active 781-char remark
-
2026-04-28historical
-
2026-04-16price $56,000
-
2026-04-04$63,000 Active
ⓘ Source: listings_history table (triggers on properties + properties_extension) + one-shot
backfill from property_details.listing_events for pre-trigger history.
Tax reassessment forecast SD · Resets to sale price
- Current annual tax
- $410 · $34/mo
- Projected year-2 tax
- $629 · $52/mo
- Expected delta
- +$218/yr (+$18/mo · 53.2%)
ⓘ Screening estimate from a state-policy table — verify with the county assessor before closing.
Climate risk First Street
- Flood 1/10 Low FEMA zone X (unshaded) · 0% chance over 30 yrs
- Wildfire 3/10 Moderate
- Heat 2/10 Low 7 d/yr ≥99°F today · 14 d/yr by 30 yrs out
- Wind 2/10 Low
- Air quality 2/10 Low 1 unhealthy d/yr today · 1 by 30 yrs out
Nearby sold comps map
Loading sold comps map…
Walkable amenities ~0.75 mi
Loading nearby amenities…
Taxation est. · year 1
- Rental income
- $15,608
- − Mortgage interest
- −$2,689
- − Property taxes
- −$410
- − Insurance
- −$240
- − Repairs & maintenance
- −$1,249
- − Management
- −$1,249
- − HOA
- −$10,200
- − Depreciation
- −$1,396
- Taxable loss
- −$1,824
- Est. tax savings @ 24.0%
- +$438
- After-tax cash flow
- $-1,102/yr
For passive investors: Depreciation is non-cash, so a rental often shows a tax loss while cash-flowing — sheltering income. Rental losses are passive: they offset passive income freely, and up to $25,000/yr can offset ordinary (W-2) income if you actively participate and your MAGI is under $100k (phasing out to $0 by $150k); unused losses carry forward. On sale, claimed depreciation is recaptured at up to 25%, and gains may owe capital-gains tax (a 1031 exchange can defer both). Figures are a year-1 estimate at your 24.0% rate — not tax advice; consult a CPA.
Schools (NCES district)
- District
- Sioux Falls School District 49-5
- NCES district ID
- 4666270
- Math proficiency
- 39% ▼ -4.00%
- Reading proficiency
- 48% ▼ -2.00%
- Median HH income
- $51,093
- Composite
- 37.47/100
- National rank
- #4407
- State rank
- #45 of 59 in SD
Livability — Sioux Falls
- Score
- 85/100
- State rank
- #3
- US rank
- #610
Category grades
Schools grade is shown separately in the Schools card above.
Census & demographics
- Census place
- Sioux Falls, SD
- County
- Minnehaha County · 191,523 people
- City population
- 207,623
- Metro
- Sioux Falls, SD
- Population (ZIP)
- 12,605
- Household income
- $74,141
- Rent vs Own
- Severe rent burden
- 360.0
Population outlook (Minnehaha County) Hauer SSP2
- Today (2025)
- 222,323 people
- By 2030
- 241,430 · +8.6%
- By 2040
- 281,643 · +26.7%
- By 2050
- 325,574 · +46.4%
- By 2075
- 469,313 · +111.1%
- By 2100
- 664,763 · +199.0%
Race, ethnicity, and origin ACS 2023
- Neighborhood character
- Predominantly White (70%)
- Race & ethnicity
- White 70% Hispanic / Latino 15% Black 9% Two or more races 8% Asian 2%
- Hispanic origin (detail)
- Mexican 7%
- Common ancestry
- Portuguese 11% Iranian 4% Lithuanian 1%
- Foreign-born
- 11% · Canada, South Korea, Philippines
- Languages at home
- 87% English-only · Spanish 9% Other Asian/Pacific 1% Russian/Polish/Slavic 1%
Political lean MEDSL · Minnehaha
- 2024 margin
- R (+12.7) · D 42.5% · R 55.2% · Other 2.4%
- 2008→2024 swing
- -13.4pp toward R · 2008: 0.7pp · 2024: -12.7pp
- All cycles
- 2024: R+12.7 2020: R+9.5 2016: R+14.6 2012: R+7.4 2008: D+0.7
Not yet ingested
- Civics
- —
Market trends
- HPI YoY
- ▼ -62.13%
- Current HPI
- 225.7479
- Rent YoY
- —
- Metro
- Sioux Falls, SD
- State GDP YoY
- ▲ 0.70%
- F500 in state
- 2
Industry mix (Fortune 500 HQ in SD)
| Industry | F500 HQs | Revenue |
|---|---|---|
| Utilities | 1 | $1B |
|
||
Price history
-23.8% since first listed6 events — show timeline
- 2026-05-12 Pending — REALTOR® Association of the Sioux Empire
- 2026-05-06 Price Changed $48,000 REALTOR® Association of the Sioux Empire
- 2026-04-28 Listing Removed — REALTOR® Association of the Sioux Empire
- 2026-04-28 Listed $53,000 REALTOR® Association of the Sioux Empire
- 2026-04-16 Price Changed $56,000 REALTOR® Association of the Sioux Empire
- 2026-04-04 Listed $63,000 REALTOR® Association of the Sioux Empire
Property tax history
-2.9%/yrLatest (2024): $410 · -6.7% YoY. Source: county tax records.
Cash-flow waterfall
monthlySold comps — $/sqft
last 12 mo · ≤1 miLoading sold comps…