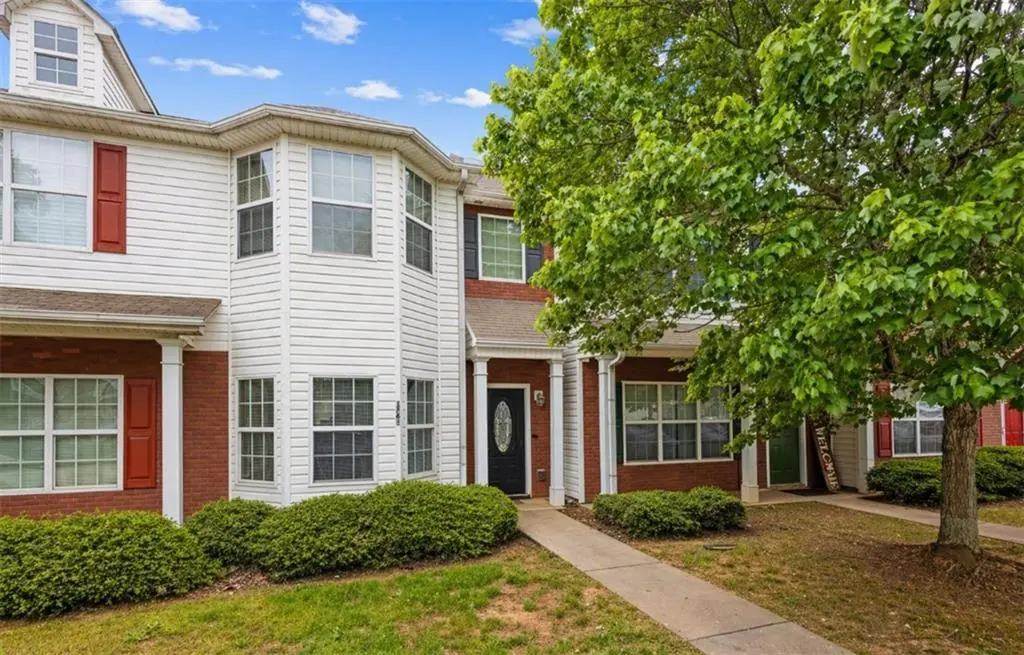
1761 Glen View Way
Lovejoy, GA 30228
$154,777C+
3 bd · 3.0 ba ·
1,426 sqft ·
Built 2004
· Townhouse
· Pending
· 9 DOM
Cashflow @ list (25.0% down · 7.5%)
Estimated rent
$1,880/mo
Mortgage (P&I)
−$812
Tax + insurance
−$312
HOA
−$45
Vac / Maint / Mgmt
−$395
Net cashflow
$316/mo
Annual
$3,795/yr
Cap rate
8.74%
Cash-on-cash
8.76%
DSCR
1.39
1% rule
1.21%
Cash to close
$43,338
Investor read
- This is a 3-bed/3.0-bath townhouse listed at $155k.
- At list price, monthly cash flow is $316 ($4k/yr) — positive.
- The deal already cash-flows at list — no discount required.
- Meets the 1% rule at list price ($2k rent vs $155k).
- Only 9 days on market — expect competitive offers; lowballing is unlikely to land.
- Local home prices are declining (-3.0%/yr); year-one equity from $1k of loan paydown is wiped out by about $5k of value loss. Plan a longer hold.
- Location reads 62/100 on livability (#317 in GA) — a middle-class / working-renter tenant base. Strengths: cost of living A+, housing A+; Watch: employment C-, amenities F, commute F.
- Clayton County (suburban): math 11% / reading 20% proficiency, ranked #155 of 174 in GA (top 89%) — low school quality limits family demand, transient renter base, plan for 1-2y turnover; 78% free/reduced lunch — lower-income household profile, screen leases tightly.
- Zoned schools: Michelle Obama Stem Elementary Academy (math 12% / reading 27%, grade F, #878 of 1,228 statewide, top 75%, 1,019 students, 90% FRL); Eddie White Middle School (math 8% / reading 22%, grade F, #399 of 470 statewide, top 86%, 1,438 students, 90% FRL); Lovejoy High School (math 7% / reading 8%, grade F, #378 of 424 statewide, top 91%, 2,136 students, 90% FRL).
- Market conditions: Rents rising (+2.2%/yr); 547 active listings in the ZIP; 40 comparable units currently listed for rent nearby; rentals lingering (median 44d on market — plan ~5-8 weeks vacancy on turnover, expect pricing pressure); 50% of comp listings sitting > 30 days — soft ceiling on asking rent; solid renter incomes; 865 units permitted in Clayton County in 2024 (448 in 5+ unit buildings).
- Clayton County population projected at +29% by 2050 — long-run rental-demand tailwind backs the buy-and-hold thesis.
- 6 sale attempts since 14y ago with the ask held roughly flat each time — persistent listings suggest the price (not the market) is what's stuck; bring a comps-based counter.
- Climate carrying-cost: major wind risk, 27% chance of damaging wind over 30y; extreme-heat days projected 7→20/yr by 2055 (HVAC capex compounding) — expect insurance premiums to compound above CPI over the hold.
- Cap rate 8.7% vs local median 4.4% in Lovejoy — top-decile yield for the area; either an underpriced asset or a hidden risk that comps aren't pricing in. Stress-test before assuming the spread holds.
Questions for listing agent
- What does the HOA fee cover, when was the last increase, and are there any pending special assessments or reserve-fund shortfalls?
- Is there a deadline driving the sale (1031 exchange, divorce, estate, relocation)? That informs how much negotiation room exists.
- Schools are F-rated, which usually means shorter tenancies and higher turnover. Who's the typical renter profile here, and what's been the actual vacancy rate?
- What's the average days-on-market for RENTAL listings here right now (not sales)? A rising rental-DOM trend means longer vacancies and softer asking-rent achievability than the comps imply.
- What's the recent tenant-quality profile in this submarket — average credit score on applications, eviction rate, late-payment / NSF rate, and stable-employment percentage? A property-management company in the area should have these aggregated.
- How much new for-sale + rental construction is in the pipeline within 1–3 miles? Heavy new supply typically softens prices + rents 12–24 months out; constrained supply supports both.
CashFlowRE · CFR-YPBFAP09GS8PQT
· Data 3 weeks ago
cashflowre.app · 2026-05-29