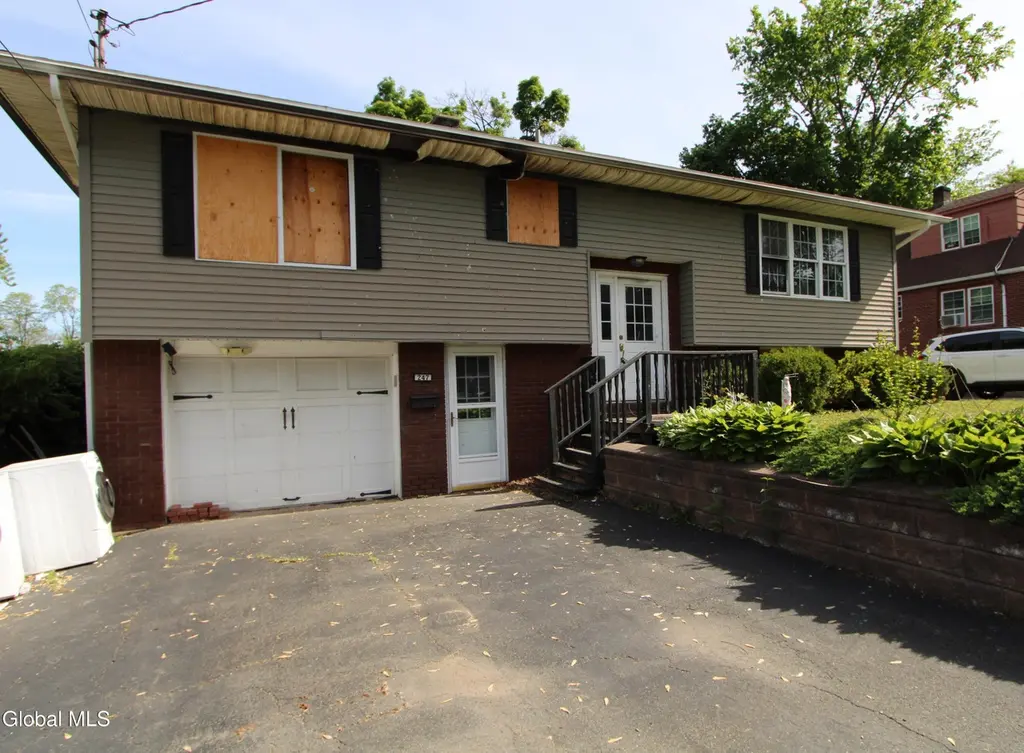
247 Pinehurst Ave
Hampton Manor, NY 12144
$103,000B
4 bd · 2.0 ba ·
1,872 sqft ·
Built 1967
· SingleFamily
· Pending
· 2 DOM
Cashflow @ list (25.0% down · 7.5%)
Estimated rent
$2,641/mo
Mortgage (P&I)
−$540
Tax + insurance
−$172
HOA
−$0
Vac / Maint / Mgmt
−$555
Net cashflow
$1,375/mo
Annual
$16,498/yr
Cap rate
22.31%
Cash-on-cash
57.21%
DSCR
3.55
1% rule
2.56%
Cash to close
$28,840
Investor read
- This is a 4-bed/2.0-bath single-family listed at $103k.
- At list price, monthly cash flow is $1k ($16k/yr) — positive.
- The deal already cash-flows at list — no discount required.
- Meets the 1% rule at list price ($3k rent vs $103k).
- Only 2 days on market — expect competitive offers; lowballing is unlikely to land.
- Local home prices are declining (-3.0%/yr); year-one equity from $712 of loan paydown is wiped out by about $3k of value loss. Plan a longer hold.
- Location reads 77/100 on livability (#189 in NY, #2,794 nationally) — a middle-class / working-renter tenant base. Strengths: employment A+, housing A+, health & safety A+; Watch: amenities F, commute F.
- East Greenbush Central School District (suburban): math 68% / reading 71% proficiency, ranked #132 of 590 in NY (top 22%) — acceptable for families but not a draw, mixed tenant base, ~2y average lease; only 15% free/reduced lunch — higher-income household profile.
- Zoned schools: Red Mill School (math 62% / reading 72%, grade B+, #525 of 2,108 statewide, top 27%, 456 students, 30% FRL); Howard L Goff School (math 61% / reading 73%, grade A-, #101 of 729 statewide, top 15%, 978 students, 28% FRL); Columbia High School (math 97% / reading 87%, grade A+, #171 of 1,100 statewide, top 18%, 1,252 students, 27% FRL).
- Market conditions: Rents flat; 102 active listings in the ZIP; solid renter incomes; 405 units permitted in Rensselaer County in 2024 (224 in 5+ unit buildings).
- Rensselaer County population projected to shrink 6% by 2050 — rents likely to lag national; underwrite the cash flow, not the appreciation.
- At projected returns (-3.0% appreciation + 0.9% rent growth), your $29k cash investment doubles in ~3 years — after that, you're playing with house money.
- Cap rate 22.3% vs local median 1.9% in Hampton Manor — top-decile yield for the area; either an underpriced asset or a hidden risk that comps aren't pricing in. Stress-test before assuming the spread holds.
- This rent runs 35% of the median local income ($91k/yr) — at the standard rent-burdened threshold; future hikes will face affordability resistance.
Questions for listing agent
- Built in 1967 — when were the roof, HVAC, electrical panel, plumbing, and water heater last replaced?
- Is there a deadline driving the sale (1031 exchange, divorce, estate, relocation)? That informs how much negotiation room exists.
- What's the average days-on-market for RENTAL listings here right now (not sales)? A rising rental-DOM trend means longer vacancies and softer asking-rent achievability than the comps imply.
- What's the recent tenant-quality profile in this submarket — average credit score on applications, eviction rate, late-payment / NSF rate, and stable-employment percentage? A property-management company in the area should have these aggregated.
- How much new for-sale + rental construction is in the pipeline within 1–3 miles? Heavy new supply typically softens prices + rents 12–24 months out; constrained supply supports both.
CashFlowRE · CFR-YQZ11XBFH7JHTR
· Data 3 weeks ago
cashflowre.app · 2026-05-29