247 Pinehurst Ave · Hampton Manor, NY
Flood risk 1/10 · Minimal
- FEMA flood zone
- X
- Chance of flooding over 30 yrs
- 0.0%
- Est. flood insurance / yr
- $473 – $860
Fire risk 4/10 · Minor
- Est. fire insurance / yr
- $691 – $1,283
Heat risk 4/10 · Minor
- Hot days now (above 96°F)
- 7 days/yr
- Hot days in 30 yrs
- 16 days/yr
Wind risk 3/10 · Minor
- Chance of severe wind over 30 yrs
- 6.0%
Air-quality risk 2/10 · Minimal
- Unhealthy air days now
- 0 days/yr
- Unhealthy air days in 30 yrs
- 1 days/yr
Risk factors via First Street. Map © Google.
Why this score? — see what drove the B grade
The composite is a weighted blend of 9 inputs, each scored 0–100. Each bar is that input's sub-score; the figure is the points it added to the 100-point composite (weight × sub-score).
- Cash flow +30.0/30.0
- 1% rule +10.0/10.0
- DSCR +10.0/10.0
- ARV discount +7.5/15.0
- Schools +6.1/10.0
- Livability +3.9/5.0
- Rent growth +2.7/5.0
- Condition / age +2.5/5.0
- Appreciation +0.0/10.0
$103,000
🖨 Deal sheet (PDF) 📄 Offer letter ✓ Due diligence
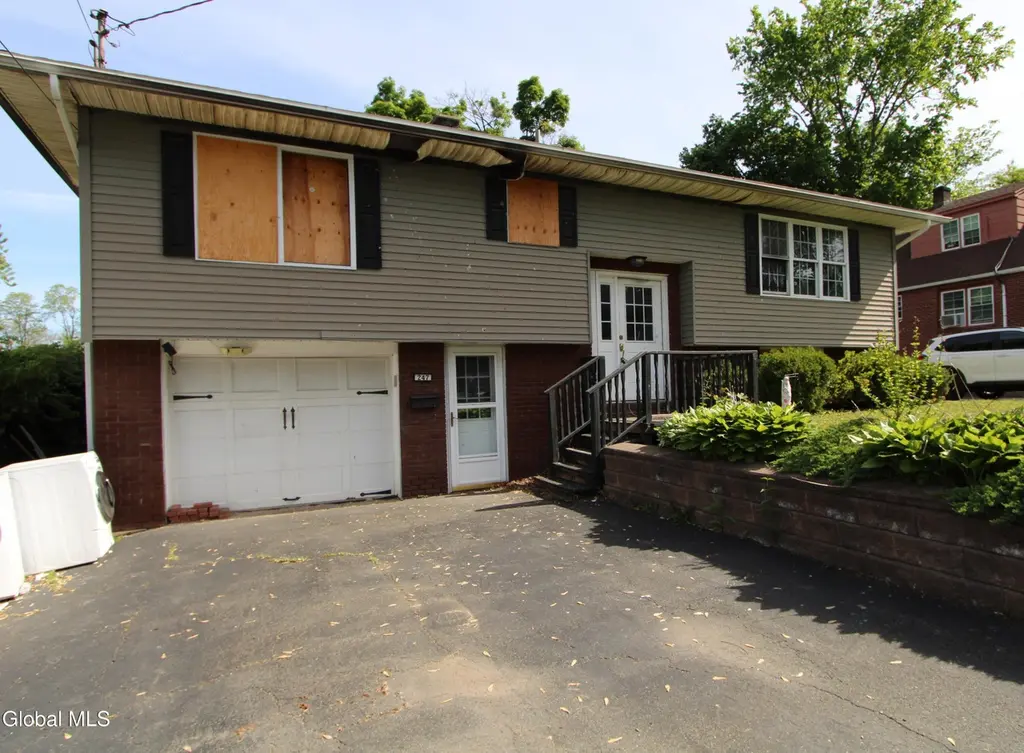
Listing remarks
Just a few minute walk to Hampton Manor Lake to enjoy playing pickleball, basketball & the playground. This home sits adjacent to Red Mill Elementary School. Entire Home had fire damage. Home has been gutted and construction has started with newly stud walls & new plywood floors. Please make appointment to see, do not enter property without Realtor. Cash sale only.
Key facts
- New plywood floors
- Newly stud walls
- Hampton manor lake
Tags
Property features AI
Exterior
- Parking: Garage (1 space); Total parking for 4 vehicles; Parking under the residence
- Utilities: Public water; Public sewer; Circuit breaker electric; Cable available
- Home design: Single family residence; Level, landscaped lot
- Construction: Vinyl siding; Block foundation; Asphalt roof; Below-grade finished area
- Exterior features: Deck; Front porch; Paved driveway; Exterior lighting; Back yard fencing
Interior
- Kitchen: Range; Refrigerator
- Bedrooms: One bedroom on the first level; Three bedrooms on the second level
- Flooring: Wood flooring
- Bathrooms: Two full bathrooms (both on the first level)
- Heating & cooling: Baseboard heating; Hot water heating; Natural gas heating
- Interior features: Walk-in closets; Sliding doors; Storm doors
- Laundry & utility: Laundry room; Laundry closet; Laundry area in bathroom
Neighborhood map
What this means for you Summary
Snapshot
- This is a 4-bed/2.0-bath single-family listed at $103k.
Deal economics
- At list price, monthly cash flow is $1k ($16k/yr) — positive.
- The deal already cash-flows at list — no discount required.
- Meets the 1% rule at list price ($3k rent vs $103k).
- Cap rate 22.3% vs local median 1.9% in Hampton Manor — top-decile yield for the area; either an underpriced asset or a hidden risk that comps aren't pricing in. Stress-test before assuming the spread holds.
Location & tenants
- Location reads 77/100 on livability (#189 in NY, #2,794 nationally) — a middle-class / working-renter tenant base. Strengths: employment A+, housing A+, health & safety A+; Watch: amenities F, commute F.
- East Greenbush Central School District (suburban): math 68% / reading 71% proficiency, ranked #132 of 590 in NY (top 22%) — acceptable for families but not a draw, mixed tenant base, ~2y average lease; only 15% free/reduced lunch — higher-income household profile.
- Zoned schools: Red Mill School (math 62% / reading 72%, grade B+, #525 of 2,108 statewide, top 27%, 456 students, 30% FRL); Howard L Goff School (math 61% / reading 73%, grade A-, #101 of 729 statewide, top 15%, 978 students, 28% FRL); Columbia High School (math 97% / reading 87%, grade A+, #171 of 1,100 statewide, top 18%, 1,252 students, 27% FRL).
- Market conditions: Rents flat; 102 active listings in the ZIP; solid renter incomes; 405 units permitted in Rensselaer County in 2024 (224 in 5+ unit buildings).
- This rent runs 35% of the median local income ($91k/yr) — at the standard rent-burdened threshold; future hikes will face affordability resistance.
Forward outlook
- Local home prices are declining (-3.0%/yr); year-one equity from $712 of loan paydown is wiped out by about $3k of value loss. Plan a longer hold.
- Rensselaer County population projected to shrink 6% by 2050 — rents likely to lag national; underwrite the cash flow, not the appreciation.
- At projected returns (-3.0% appreciation + 0.9% rent growth), your $29k cash investment doubles in ~3 years — after that, you're playing with house money.
Negotiation context
- Only 2 days on market — expect competitive offers; lowballing is unlikely to land.
Questions for the listing agent
- Built in 1967 — when were the roof, HVAC, electrical panel, plumbing, and water heater last replaced?
- Is there a deadline driving the sale (1031 exchange, divorce, estate, relocation)? That informs how much negotiation room exists.
- What's the average days-on-market for RENTAL listings here right now (not sales)? A rising rental-DOM trend means longer vacancies and softer asking-rent achievability than the comps imply.
- What's the recent tenant-quality profile in this submarket — average credit score on applications, eviction rate, late-payment / NSF rate, and stable-employment percentage? A property-management company in the area should have these aggregated.
- How much new for-sale + rental construction is in the pipeline within 1–3 miles? Heavy new supply typically softens prices + rents 12–24 months out; constrained supply supports both.
Investment metrics
- 1% rule
- 2.56% ✓
- Cap rate
- 22.31%
- Cash-on-cash
- 57.21%
- DSCR
- 3.55
- GRM
- 3.2
CMA / ARV
- ARV (on-the-fly)
- $396,864
- Comps found
- 12
Show comp detail 12 sales within ~0.75 mi
| Address | Dist | Beds/Ba | Sqft | Sold | Price | $/sf | Match |
|---|---|---|---|---|---|---|---|
| 273 Pinehurst Ave | 0.14mi | 4/2.5 | 1,915 (+2%) | 7mo | $283,000 | $148 | 82 |
| 235 Tampa Ave | 0.05mi | 3/3.0 (-1) | 1,954 (+4%) | 9mo | $260,000 | $133 | 74 |
| 10 Massachusetts Ave | 0.28mi | 3/2.0 (-1) | 1,825 (-2%) | 8mo | $310,000 | $170 | 72 |
| 198 Mccullough Pl | 0.09mi | 3/2.0 (-1) | 1,748 (-7%) | 11mo | $370,000 | $212 | 71 |
| 125 Hampton Ave | 0.25mi | 3/2.0 (-1) | 1,710 (-9%) | 12mo | $267,000 | $156 | 59 |
| 209 Hudson Ave East | 0.16mi | 5/2.0 (+1) | 1,622 (-13%) | 8mo | $275,000 | $170 | 58 |
| 29 Massachusetts Ave | 0.40mi | 3/1.0 (-1) | 1,725 (-8%) | 4mo | $260,000 | $151 | 56 |
| 8 Rysedorph Ln | 0.33mi | 4/3.5 | 2,070 (+11%) | 6mo | $582,000 | $281 | 55 |
| 23 Hampton Ave | 0.37mi | 3/2.0 (-1) | 1,616 (-14%) | 10mo | $365,000 | $226 | 46 |
| 33 Robin Ln | 0.63mi | 3/2.5 (-1) | 2,008 (+7%) | 12mo | $505,000 | $251 | 42 |
| 64 Robin Ln | 0.51mi | 3/1.5 (-1) | 1,612 (-14%) | 8mo | $350,000 | $217 | 39 |
| 4 Deer Run | 0.74mi | 3/2.5 (-1) | 1,652 (-12%) | 2mo | $503,000 | $304 | 37 |
Match score weights: distance 35% · size 25% · config 20% · recency 20%. Top-matched comps best support the ARV.
Projected returns pro-forma
-3.0% appreciation · 0.9% rent growth · sell at horizon
- IRR
- 53.3%
- Equity multiple
- 3.27×
- Total profit
- $65,448
- Equity at exit
- $15,358
- IRR
- 57.7%
- Equity multiple
- 6.15×
- Total profit
- $148,402
- Equity at exit
- $8,906
Cash invested: $28,840 (down + closing). Projections, not guarantees.
Landlord ↔ Tenant lean methodology
- Overall (STATE)
- 15 Strongly Tenant-Friendly
- State New York
- 15 Strongly Tenant-Friendly · D+10
- County
- — inherits STATE
- City
- — inherits STATE
ZIP-level market 12144
- Home prices YoY
- -33.4%
- Rents YoY
- 0.9%
- Active inventory
- 102
- Price-to-rent
- 3.2×
Monthly cashflow live
- Estimated rent
- $2,641 medium interval (Pro) →
- Mortgage (P&I)
- −$540
- Tax est. 1.5%
- −$129 /mo · $1,545/yr
- Insurance
- −$43
- HOA
- −$0
- Vacancy / Maint / Mgmt
- −$555
- Net cashflow
- $1,375
Break-even live
Sensitivity live
| Price | -10% $1,446 | -5% $1,410 | +0% $1,375 | +5% $1,339 | +10% $1,304 |
|---|---|---|---|---|---|
| Rent | -10% $1,166 | -5% $1,271 | +0% $1,375 | +5% $1,479 | +10% $1,584 |
| Rate | -1.0pp $1,427 | -0.5pp $1,401 | base $1,375 | +0.5pp $1,348 | +1.0pp $1,321 |
UW: 25.0% down · 7.5% · 30yr · 1.5% tax · 5.0% vac · 8.0% maint · 8.0% mgmt
Financing live
Cash to close
- Down payment
- $25,750
- Closing costs
- $3,090
- Reserves months
- —
- Total cash needed
- —
Loan-product check · same deal, 3 products live
Conventional
25% down · 7.5% · 30yr
- Down + closing
- —
- Monthly P&I
- —
- Monthly cashflow
- —
- DSCR
- —
- Eligible?
- —
Personal DTI + credit; lowest rate.
DSCR
20% down · 8.5% · 30yr
- Down + closing
- —
- Monthly P&I
- —
- Monthly cashflow
- —
- DSCR
- —
- Eligible?
- —
No personal income docs; deal must DSCR.
Hard money
10% down · 12.0% · 12mo
- Down + closing
- —
- Monthly P&I
- —
- Monthly cashflow
- —
- DSCR
- —
- Eligible?
- —
Short-term bridge; refi at stabilization.
Listing history 1 events
-
2026-05-26$103,000 Active
ⓘ Source: listings_history table (triggers on properties + properties_extension) + one-shot
backfill from property_details.listing_events for pre-trigger history.
Climate risk First Street
- Flood 1/10 Low FEMA zone X · 0% chance over 30 yrs
- Wildfire 4/10 Moderate
- Heat 4/10 Moderate 7 d/yr ≥96°F today · 16 d/yr by 30 yrs out
- Wind 3/10 Moderate 6% chance of damaging wind over 30 yrs
- Air quality 2/10 Low 0 unhealthy d/yr today · 1 by 30 yrs out
Nearby sold comps map
Loading sold comps map…
Walkable amenities ~0.75 mi
Loading nearby amenities…
Taxation est. · year 1
- Rental income
- $31,696
- − Mortgage interest
- −$5,770
- − Property taxes
- −$1,545
- − Insurance
- −$515
- − Repairs & maintenance
- −$2,536
- − Management
- −$2,536
- − Depreciation
- −$2,996
- Taxable income
- $15,799
- Est. tax owed @ 24.0%
- −$3,792
- After-tax cash flow
- $12,707/yr
For passive investors: Depreciation is non-cash, so a rental often shows a tax loss while cash-flowing — sheltering income. Rental losses are passive: they offset passive income freely, and up to $25,000/yr can offset ordinary (W-2) income if you actively participate and your MAGI is under $100k (phasing out to $0 by $150k); unused losses carry forward. On sale, claimed depreciation is recaptured at up to 25%, and gains may owe capital-gains tax (a 1031 exchange can defer both). Figures are a year-1 estimate at your 24.0% rate — not tax advice; consult a CPA.
Schools (NCES district)
- District
- East Greenbush Central School District
- NCES district ID
- 3609630
- Math proficiency
- 68% ▼ -5.00%
- Reading proficiency
- 71% ▲ 2.00%
- Median HH income
- $73,174
- Composite
- 61.16/100
- National rank
- #783
- State rank
- #132 of 590 in NY
Livability — Hampton Manor
- Score
- 77/100
- State rank
- #189
- US rank
- #2794
Category grades
Schools grade is shown separately in the Schools card above.
Census & demographics
- Census place
- Hampton Manor, NY
- County
- Rensselaer County · 75,590 people
- City population
- 22,111
- Metro
- Albany-Schenectady-Troy, NY
- Population (ZIP)
- 22,111
- Household income
- $90,738
- Rent vs Own
- Severe rent burden
- 541.0
Population outlook (Rensselaer County) Hauer SSP2
- Today (2025)
- 162,400 people
- By 2030
- 161,746 · -0.4%
- By 2040
- 158,095 · -2.7%
- By 2050
- 152,966 · -5.8%
- By 2075
- 140,767 · -13.3%
- By 2100
- 124,727 · -23.2%
Race, ethnicity, and origin ACS 2023
- Neighborhood character
- Predominantly White (76%)
- Race & ethnicity
- White 76% Two or more races 8% Asian 7% Hispanic / Latino 6% Black 6%
- Hispanic origin (detail)
- Puerto Rican 4%
- Common ancestry
- Romanian 7% Lithuanian 6% Iranian 3%
- Foreign-born
- 7% · Philippines, Canada, China
- Languages at home
- 91% English-only · Other Asian/Pacific 3% Spanish 2% Chinese 1%
Political lean MEDSL · Rensselaer
- 2024 margin
- Toss-up / Even · D 50.7% · R 49.3%
- 2008→2024 swing
- -8.0pp toward R · 2008: 9.3pp · 2024: 1.4pp
- All cycles
- 2024: D+1.4 2020: D+5.6 2016: R+2.9 2012: D+11.8 2008: D+9.3
Not yet ingested
- Civics
- —
Market trends
- HPI YoY
- ▼ -138.26%
- Current HPI
- 276.2239
- Rent YoY
- ▲ 0.90%
- Metro
- Albany-Schenectady-Troy, NY
- State GDP YoY
- ▲ 2.60%
- F500 in state
- 92
Industry mix (Fortune 500 HQ in NY)
| Industry | F500 HQs | Revenue |
|---|---|---|
| Financial Services | 10 | $950B |
|
||
| Consumer Goods | 9 | $162B |
|
||
| Insurance | 4 | $225B |
|
||
| Telecommunications | 2 | $144B |
|
||
| Pharmaceuticals | 2 | $112B |
|
||
| Media / Entertainment | 2 | $69B |
|
||
Price history
1 event — show timeline
- 2026-05-26 Listed $103,000 Global MLS
Property tax history
+3.1%/yrLatest (2025): $7,148 · -0.7% YoY. Source: county tax records.
Cash-flow waterfall
monthlySold comps — $/sqft
last 12 mo · ≤1 miLoading sold comps…