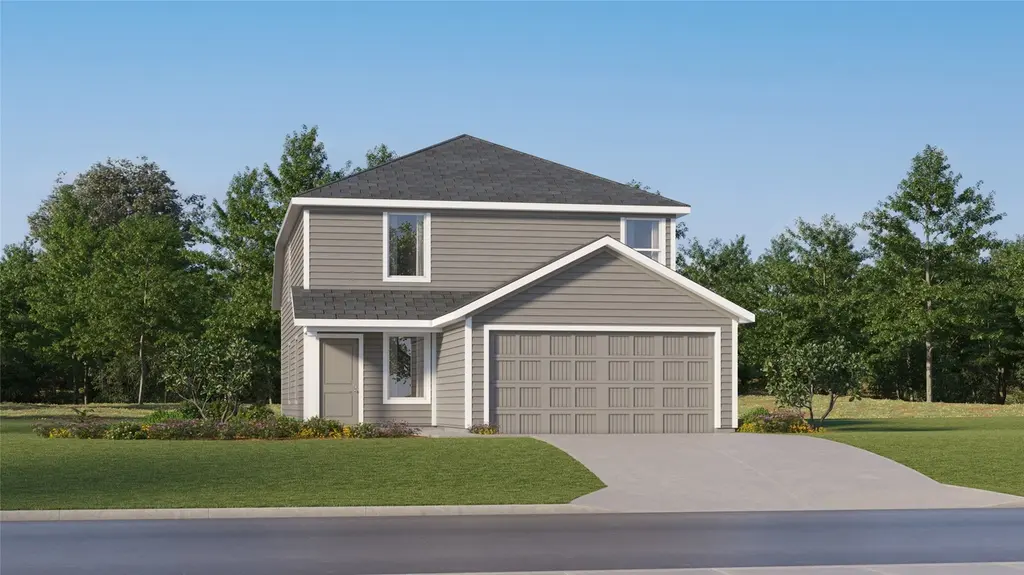
23417 Flickering Sky Dr
Elgin, TX 78621
$245,999C-
4 bd · 2.0 ba ·
1,867 sqft ·
Built 2026
· SingleFamily
· Active
· 57 DOM
Cashflow @ list (25.0% down · 7.5%)
Estimated rent
$2,174/mo
Mortgage (P&I)
−$1,290
Tax + insurance
−$410
HOA
−$55
Vac / Maint / Mgmt
−$457
Net cashflow
$-37/mo
Annual
$-448/yr
Cap rate
6.11%
Cash-on-cash
-0.65%
DSCR
0.97
1% rule
0.88%
Cash to close
$68,880
Investor read
- This is a 4-bed/2.0-bath single-family listed at $246k. Condition is rated excellent.
- At list price, monthly cash flow is $-37 ($-448/yr) — negative.
- To cash-flow at today's rent, offer at most $241k (2.2% below list).
- To meet the 1% rule (rent ≥ 1% of price), the offer needs to be $217k (11.6% below list).
- It's been on market 57 days — a 3% lower offer ($239k) is reasonable based on typical stale-listing flexibility.
- Recommended offer: $217k (11.6% below list) — sets the bar for 1% rule.
- In year one you build about $26k of equity ($2k loan paydown + $25k appreciation (10.0% local appreciation)).
- Location reads 74/100 on livability (#167 in TX, #4,404 nationally) — a middle-class / working-renter tenant base. Strengths: cost of living A+, housing A+, health & safety A+; Watch: schools F, amenities F, commute F.
- Elgin ISD (rural): math 17% / reading 26% proficiency, ranked #741 of 826 in TX (top 90%) — low school quality limits family demand, transient renter base, plan for 1-2y turnover; 67% free/reduced lunch — lower-income household profile, screen leases tightly.
- Market conditions: Rents rising (+3.1%/yr); 807 active listings in the ZIP; 17 comparable units currently listed for rent nearby; rentals at typical pace (median 20d on market — plan ~3-4 weeks tenant-placement turnaround); solid renter incomes; 17,121 units permitted in Travis County in 2024 (11,963 in 5+ unit buildings).
- Travis County population projected at +60% by 2050 — long-run rental-demand tailwind backs the buy-and-hold thesis.
- At projected returns (10.0% appreciation + 3.1% rent growth), your $69k cash investment doubles in ~3 years — after that, you're playing with house money.
- By year 2, paydown + projected appreciation supports a ~$42k cash-out refi (75% LTV) — recoverable capital for the next deal without selling this one.
- Cap rate 6.1% vs local median 4.4% in Elgin — top-decile yield for the area; either an underpriced asset or a hidden risk that comps aren't pricing in. Stress-test before assuming the spread holds.
Questions for listing agent
- What do current leases actually rent for vs. the listed asking? Can we see a recent rent roll and the last 12 months of T-12 income?
- It's been on market 57 days. Have you received any prior offers? Is the seller open to a 12% concession, seller financing, or rate buy-down credit?
- What does the HOA fee cover, when was the last increase, and are there any pending special assessments or reserve-fund shortfalls?
- Is there a deadline driving the sale (1031 exchange, divorce, estate, relocation)? That informs how much negotiation room exists.
- Schools are F-rated, which usually means shorter tenancies and higher turnover. Who's the typical renter profile here, and what's been the actual vacancy rate?
- What's the average days-on-market for RENTAL listings here right now (not sales)? A rising rental-DOM trend means longer vacancies and softer asking-rent achievability than the comps imply.
- What's the recent tenant-quality profile in this submarket — average credit score on applications, eviction rate, late-payment / NSF rate, and stable-employment percentage? A property-management company in the area should have these aggregated.
- How much new for-sale + rental construction is in the pipeline within 1–3 miles? Heavy new supply typically softens prices + rents 12–24 months out; constrained supply supports both.
CashFlowRE · CFR-YR8MBPDDQMEDK0
· Data 2 days ago
cashflowre.app · 2026-05-29