23417 Flickering Sky Dr · Elgin, TX
Flood risk No data
- FEMA flood zone
- —
- Chance of flooding over 30 yrs
- —
- Est. flood insurance / yr
- —
Fire risk No data
- Est. fire insurance / yr
- —
Heat risk No data
- Hot days now (above threshold)
- —
- Hot days in 30 yrs
- —
Wind risk No data
- Chance of severe wind over 30 yrs
- —
Air-quality risk No data
- Unhealthy air days now
- —
- Unhealthy air days in 30 yrs
- —
Risk factors via First Street. Map © Google.
Why this score? — see what drove the C- grade
The composite is a weighted blend of 9 inputs, each scored 0–100. Each bar is that input's sub-score; the figure is the points it added to the 100-point composite (weight × sub-score).
- Cash flow +12.5/30.0
- Appreciation +10.0/10.0
- ARV discount +9.4/15.0
- Condition / age +5.0/5.0
- 1% rule +3.8/10.0
- DSCR +3.7/10.0
- Livability +3.7/5.0
- Rent growth +3.3/5.0
- Schools +2.0/10.0
$245,999
🖨 Deal sheet 📄 Offer letter ✓ Due diligence
Listing remarks MLS
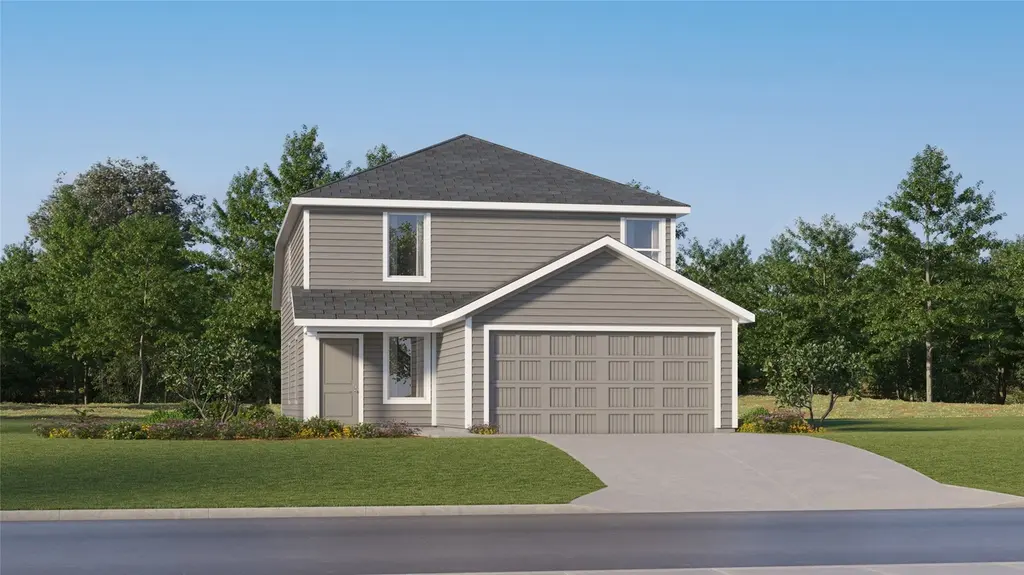
The Morrow - This new two-story home boasts a spacious and modern design. On the first floor, a flexible open-concept floorplan combines the kitchen, living and dining areas, and the luxurious owner’s suite is tucked into a private rear corner with a spa-inspired bathroom and walk-in closet. On the second floor, three secondary bedrooms surround a versatile loft for convenient shared living. Photos are for illustrative purposes only. Estimated Completion July 2026. The completion date, prices and features may vary and are subject to change. Please verify with Lennar directly.
Key facts
- Walk-in closet
- Versatile loft
- 4,791 sq ft lot
Tags
Neighborhood map
What this means for you Summary
Snapshot
- This is a 4-bed/2.0-bath single-family listed at $246k. Condition is rated excellent.
Deal economics
- At list price, monthly cash flow is $-37 ($-448/yr) — negative.
- To cash-flow at today's rent, offer at most $241k (2.2% below list).
- To meet the 1% rule (rent ≥ 1% of price), the offer needs to be $217k (11.6% below list).
- Recommended offer: $217k (11.6% below list) — sets the bar for 1% rule.
- Cap rate 6.1% vs local median 4.4% in Elgin — top-decile yield for the area; either an underpriced asset or a hidden risk that comps aren't pricing in. Stress-test before assuming the spread holds.
Location & tenants
- Location reads 74/100 on livability (#167 in TX, #4,404 nationally) — a middle-class / working-renter tenant base. Strengths: cost of living A+, housing A+, health & safety A+; Watch: schools F, amenities F, commute F.
- Elgin ISD (rural): math 17% / reading 26% proficiency, ranked #741 of 826 in TX (top 90%) — low school quality limits family demand, transient renter base, plan for 1-2y turnover; 67% free/reduced lunch — lower-income household profile, screen leases tightly.
- Market conditions: Rents rising (+3.1%/yr); 807 active listings in the ZIP; 17 comparable units currently listed for rent nearby; rentals at typical pace (median 20d on market — plan ~3-4 weeks tenant-placement turnaround); solid renter incomes; 17,121 units permitted in Travis County in 2024 (11,963 in 5+ unit buildings).
Forward outlook
- In year one you build about $26k of equity ($2k loan paydown + $25k appreciation (10.0% local appreciation)).
- Travis County population projected at +60% by 2050 — long-run rental-demand tailwind backs the buy-and-hold thesis.
- At projected returns (10.0% appreciation + 3.1% rent growth), your $69k cash investment doubles in ~3 years — after that, you're playing with house money.
- By year 2, paydown + projected appreciation supports a ~$42k cash-out refi (75% LTV) — recoverable capital for the next deal without selling this one.
Negotiation context
- It's been on market 57 days — a 3% lower offer ($239k) is reasonable based on typical stale-listing flexibility.
Questions for the listing agent
- What do current leases actually rent for vs. the listed asking? Can we see a recent rent roll and the last 12 months of T-12 income?
- It's been on market 57 days. Have you received any prior offers? Is the seller open to a 12% concession, seller financing, or rate buy-down credit?
- What does the HOA fee cover, when was the last increase, and are there any pending special assessments or reserve-fund shortfalls?
- Is there a deadline driving the sale (1031 exchange, divorce, estate, relocation)? That informs how much negotiation room exists.
- Schools are F-rated, which usually means shorter tenancies and higher turnover. Who's the typical renter profile here, and what's been the actual vacancy rate?
- What's the average days-on-market for RENTAL listings here right now (not sales)? A rising rental-DOM trend means longer vacancies and softer asking-rent achievability than the comps imply.
- What's the recent tenant-quality profile in this submarket — average credit score on applications, eviction rate, late-payment / NSF rate, and stable-employment percentage? A property-management company in the area should have these aggregated.
- How much new for-sale + rental construction is in the pipeline within 1–3 miles? Heavy new supply typically softens prices + rents 12–24 months out; constrained supply supports both.
Investment metrics
- 1% rule
- 0.88% ✗
- Cap rate
- 6.11%
- Cash-on-cash
- -0.65%
- DSCR
- 0.97
- GRM
- 9.4
CMA / ARV
- ARV (median comp)
- $256,740
- List price
- $245,999
- Delta
- -4.18%
- Verdict
- FAIR
- Comps
- 20 within 1.0 mi
Show comp detail 12 sales within ~0.75 mi
| Address | Dist | Beds/Ba | Sqft | Sold | Price | $/sf | Match |
|---|---|---|---|---|---|---|---|
| 13413 Trumpet Creeper Dr | 0.02mi | 4/2.0 | 1,867 (0%) | 1mo | $266,999 | $143 | 98 |
| 13320 Winton Dr | 0.06mi | 3/2.0 (-1) | 1,904 (+2%) | 1mo | $268,000 | $141 | 88 |
| 13317 Winton Dr | 0.08mi | 4/3.0 | 1,913 (+2%) | 0mo | $286,999 | $150 | 88 |
| 13313 Winton Dr | 0.08mi | 3/2.0 (-1) | 1,904 (+2%) | 1mo | $290,000 | $152 | 87 |
| 13401 Trumpet Creeper Dr | 0.04mi | 4/2.5 | 1,954 (+5%) | 2mo | $257,990 | $132 | 87 |
| 13301 Winton Dr | 0.11mi | 3/2.0 (-1) | 1,904 (+2%) | 2mo | $277,000 | $145 | 85 |
| 23409 Firelight Dr | 0.13mi | 4/2.5 | 1,954 (+5%) | 2mo | $261,990 | $134 | 82 |
| 23813 Glowing Embers Dr | 0.35mi | 4/2.5 | 1,891 (+1%) | 1mo | $258,999 | $137 | 79 |
| 13333 Trumpet Creeper Dr | 0.05mi | 4/2.0 | 1,600 (-14%) | 2mo | $244,991 | $153 | 72 |
| 23616 Tiny Moons Way | 0.19mi | 4/2.0 | 1,600 (-14%) | 2mo | $252,990 | $158 | 66 |
| 23821 Glowing Embers Dr | 0.37mi | 4/2.0 | 1,667 (-11%) | 1mo | $245,999 | $148 | 64 |
| 23829 Glowing Embers Dr | 0.39mi | 4/2.0 | 1,667 (-11%) | 2mo | $249,990 | $150 | 62 |
Match score weights: distance 35% · size 25% · config 20% · recency 20%. Top-matched comps best support the ARV.
Projected returns pro-forma
10.0% appreciation · 3.12% rent growth · sell at horizon
- IRR
- 23.9%
- Equity multiple
- 2.92×
- Total profit
- $131,929
- Equity at exit
- $221,615
- IRR
- 21.2%
- Equity multiple
- 6.68×
- Total profit
- $391,047
- Equity at exit
- $477,922
Cash invested: $68,880 (down + closing). Projections, not guarantees.
Landlord ↔ Tenant lean methodology
- Overall (STATE)
- 87 Strongly Landlord-Friendly
- State Texas
- 87 Strongly Landlord-Friendly · R+5
- County
- — inherits STATE
- City
- — inherits STATE
ZIP-level market 78621
- Home prices YoY
- 7.6%
- Rents YoY
- 3.1%
- Active inventory
- 807
- Price-to-rent
- 9.4×
Monthly cashflow live
- Estimated rent
- $2,174 high interval (Pro) →
- Mortgage (P&I)
- −$1,290
- Tax est. 1.5%
- −$307 /mo · $3,690/yr
- Insurance
- −$102
- HOA
- −$55
- Vacancy / Maint / Mgmt
- −$457
- Net cashflow
- $-37
Break-even live
UW: 25.0% down · 7.5% · 30yr · 1.5% tax · 5.0% vac · 8.0% maint · 8.0% mgmt
Financing live
Cash to close
- Down payment
- $61,500
- Closing costs
- $7,380
- Reserves months
- —
- Total cash needed
- —
Loan-product check · same deal, 3 products live
Conventional
25% down · 7.5% · 30yr
- Down + closing
- —
- Monthly P&I
- —
- Monthly cashflow
- —
- DSCR
- —
- Eligible?
- —
Personal DTI + credit; lowest rate.
DSCR
20% down · 8.5% · 30yr
- Down + closing
- —
- Monthly P&I
- —
- Monthly cashflow
- —
- DSCR
- —
- Eligible?
- —
No personal income docs; deal must DSCR.
Hard money
10% down · 12.0% · 12mo
- Down + closing
- —
- Monthly P&I
- —
- Monthly cashflow
- —
- DSCR
- —
- Eligible?
- —
Short-term bridge; refi at stabilization.
Rent comps 17 comps
| Address | Beds | Baths | Sqft | Rent | $/sqft | DOM | Units | Dist |
|---|---|---|---|---|---|---|---|---|
| 23408 Tiny Moons Way Elgin, TX | 4.0 | 2.5 | 2000 | $1,960 | $0.98 | 20d | 1 | 0.11mi |
| 13249 Illumination Rd Unit R3 Elgin, TX | 4.0 | 3.0 | 2000 | $560 | $0.28 | 21d | 1 | 0.22mi |
| 13249 Illumination Rd Unit R2 Elgin, TX | 4.0 | 3.0 | 2000 | $600 | $0.30 | 17d | 1 | 0.22mi |
| 13249 Illumination Rd Unit R4 Elgin, TX | 4.0 | 3.0 | 2000 | $589 | $0.29 | 43d | 1 | 0.33mi |
| 13501 Mussel Run Elgin, TX | 4.0 | 2.0 | 1667 | $1,800 | $1.08 | 16d | 1 | 0.66mi |
| 13305 Banquete St Elgin, TX | 4.0 | 2.0 | 1707 | $1,995 | $1.17 | 43d | 1 | 0.68mi |
| 13124 Maidenhair Trl Elgin, TX | 4.0 | 2.0 | 1448 | $1,775 | $1.23 | 16d | 1 | 0.76mi |
| 13124 Maidenhair Trl Elgin, TX | 4.0 | 2.0 | 1448 | $1,775 | $1.23 | 23d | 1 | 0.76mi |
| 13520 Knights Branch Dr Elgin, TX | 3.0 | 2.5 | 1600 | $1,850 | $1.16 | 1d | 1 | 0.81mi |
| 17812 Prairie Verbena Ln Elgin, TX | 3.0 | 2.5 | 2049 | $2,199 | $1.07 | 43d | 1 | 0.81mi |
| 13604 Menard Way Elgin, TX | 3.0 | 2.0 | 1474 | $1,875 | $1.27 | 23d | 1 | 0.82mi |
| 13725 Knights Branch Dr Elgin, TX | 4.0 | 2.5 | 1800 | $2,100 | $1.17 | 23d | 1 | 0.92mi |
| 13804 Knights Branch Dr Elgin, TX | 3.0 | 2.5 | 1427 | $1,900 | $1.33 | 4d | 1 | 0.93mi |
| 13121 Blackeyed Susan Trl Elgin, TX | 4.0 | 2.0 | 1586 | $1,800 | $1.13 | 17d | 1 | 0.98mi |
| 14129 Tordillo Dr Elgin, TX | 4.0 | 2.5 | 1874 | $2,675 | $1.43 | 23d | 1 | 1.05mi |
| 14129 Tordillo Dr Unit NA Elgin, TX | 4.0 | 2.5 | 1874 | $2,595 | $1.38 | 4d | 1 | 1.05mi |
| 13501 Sierra Wind Ln Elgin, TX | 4.0 | 2.5 | 2066 | $2,500 | $1.21 | 19d | 1 | 1.41mi |
HOA detail
- Monthly dues
- $55 · $660/yr
Listing history 16 events
-
2026-06-18days on market $245,999 Active 57 DOM
-
2026-06-17days on market $245,999 Active 56 DOM
-
2026-06-16days on market $245,999 Active 55 DOM
-
2026-06-15days on market $245,999 Active 54 DOM
-
2026-06-13days on market $245,999 Active 52 DOM
-
2026-06-09pricedays on market $245,999 Active 48 DOM
-
2026-06-08days on market $248,999 Active 47 DOM
-
2026-06-07days on market $248,999 Active 46 DOM
-
2026-06-04days on market $248,999 Active 43 DOM
-
2026-06-03days on market $248,999 Active 42 DOM
-
2026-06-02days on market $248,999 Active 41 DOM
-
2026-06-01days on market $248,999 Active 40 DOM
-
2026-05-31days on market $248,999 Active 39 DOM
-
2026-05-11price $269,999 588-char remark
Show marketing remark (588 chars)
The Morrow - This new two-story home boasts a spacious and modern design. On the first floor, a flexible open-concept floorplan combines the kitchen, living and dining areas, and the luxurious owner’s suite is tucked into a private rear corner with a spa-inspired bathroom and walk-in closet. On the second floor, three secondary bedrooms surround a versatile loft for convenient shared living. Photos are for illustrative purposes only. Estimated Completion July 2026. The completion date, prices and features may vary and are subject to change. Please verify with Lennar directly.
-
2026-05-08price $270,999 588-char remark
Show marketing remark (588 chars)
The Morrow - This new two-story home boasts a spacious and modern design. On the first floor, a flexible open-concept floorplan combines the kitchen, living and dining areas, and the luxurious owner’s suite is tucked into a private rear corner with a spa-inspired bathroom and walk-in closet. On the second floor, three secondary bedrooms surround a versatile loft for convenient shared living. Photos are for illustrative purposes only. Estimated Completion July 2026. The completion date, prices and features may vary and are subject to change. Please verify with Lennar directly.
-
2026-04-22$269,999 Active 588-char remark
Show marketing remark (588 chars)
The Morrow - This new two-story home boasts a spacious and modern design. On the first floor, a flexible open-concept floorplan combines the kitchen, living and dining areas, and the luxurious owner’s suite is tucked into a private rear corner with a spa-inspired bathroom and walk-in closet. On the second floor, three secondary bedrooms surround a versatile loft for convenient shared living. Photos are for illustrative purposes only. Estimated Completion July 2026. The completion date, prices and features may vary and are subject to change. Please verify with Lennar directly.
ⓘ Source: listings_history table (triggers on properties + properties_extension) + one-shot
backfill from property_details.listing_events for pre-trigger history.
Nearby sold comps map
Loading sold comps map…
Walkable amenities ~0.75 mi
Loading nearby amenities…
Taxation est. · year 1
- Rental income
- $26,092
- − Mortgage interest
- −$13,780
- − Property taxes
- −$3,690
- − Insurance
- −$1,230
- − Repairs & maintenance
- −$2,087
- − Management
- −$2,087
- − HOA
- −$660
- − Depreciation
- −$7,156
- Taxable loss
- −$4,599
- Est. tax savings @ 24.0%
- +$1,104
- After-tax cash flow
- $656/yr
For passive investors: Depreciation is non-cash, so a rental often shows a tax loss while cash-flowing — sheltering income. Rental losses are passive: they offset passive income freely, and up to $25,000/yr can offset ordinary (W-2) income if you actively participate and your MAGI is under $100k (phasing out to $0 by $150k); unused losses carry forward. On sale, claimed depreciation is recaptured at up to 25%, and gains may owe capital-gains tax (a 1031 exchange can defer both). Figures are a year-1 estimate at your 24.0% rate — not tax advice; consult a CPA.
Condition & rehab AI · 6 photos
This new two-story home boasts a modern and spacious design, with new exterior, interior, kitchen, bathrooms, flooring, and landscaping. It is move-in ready and ideal for both resale and rental.
Value-add opportunities
- Both Landscaping and curb appeal improvements — Enhances curb appeal and adds value for both resale and rental.
- Both Interior updates to match the exterior — Ensures a cohesive and modern aesthetic throughout the home, enhancing both resale and rental value.
Renovation cost estimate screening
Value-add ROI direction
- Both Landscaping and curb appeal improvements — Enhances curb appeal and adds value for both resale and rental. ↑
- Both Interior updates to match the exterior — Ensures a cohesive and modern aesthetic throughout the home, enhancing both resale and rental value. ↑
ⓘ Cost ranges are severity-bucket heuristics (US national rule-of-thumb). Get contractor quotes + a written scope before underwriting a rehab budget.
Schools (NCES district)
- District
- Elgin ISD
- NCES district ID
- 4818360
- Math proficiency
- 17% ▼ -9.00%
- Reading proficiency
- 26% ▼ -5.00%
- Median HH income
- $55,176
- Composite
- 19.62/100
- National rank
- #8749
- State rank
- #741 of 826 in TX
Livability — Elgin
- Score
- 74/100
- State rank
- #167
- US rank
- #4404
Category grades
Schools grade is shown separately in the Schools card above.
Census & demographics
- County
- Bastrop County · 68,601 people
- City population
- 27,860
- Metro
- Austin-Round Rock-Georgetown, TX
- Population (ZIP)
- 30,411
- Household income
- $98,534
- Rent vs Own
- Severe rent burden
- 235.0
Population outlook (Travis County) Hauer SSP2
- Today (2025)
- 1,545,133 people
- By 2030
- 1,729,269 · +11.9%
- By 2040
- 2,097,596 · +35.8%
- By 2050
- 2,463,890 · +59.5%
- By 2075
- 3,249,374 · +110.3%
- By 2100
- 3,801,868 · +146.1%
Race, ethnicity, and origin ACS 2023
- Neighborhood character
- Diverse neighborhood (Simpson 0.64)
- Race & ethnicity
- Hispanic / Latino 46% White 38% Two or more races 19% Black 11% Native American 1%
- Hispanic origin (detail)
- Mexican 38%
- Common ancestry
- Slovak 2% Italian 2% Romanian 1%
- Foreign-born
- 17% · Canada, Vietnam
- Languages at home
- 63% English-only · Spanish 36%
Political lean MEDSL · Travis
- 2024 margin
- Solid D (+39.3) · D 68.8% · R 29.4% · Other 1.8%
- 2008→2024 swing
- +9.9pp toward D · 2008: 29.4pp · 2024: 39.3pp
- All cycles
- 2024: D+39.3 2020: D+45.0 2016: D+38.9 2012: D+23.9 2008: D+29.4
Not yet ingested
- Civics
- —
Market trends
- HPI YoY
- ▲ 29.47%
- Current HPI
- 416.87
- Rent YoY
- ▲ 3.12%
- Metro
- Austin-Round Rock-Georgetown, TX
- State GDP YoY
- ▲ 3.95%
- F500 in state
- 110
Industry mix (Fortune 500 HQ in TX)
| Industry | F500 HQs | Revenue |
|---|---|---|
| Energy | 16 | $1,198B |
|
||
| Technology | 5 | $198B |
|
||
| Engineering / Construction | 4 | $72B |
|
||
| Energy Services | 3 | $60B |
|
||
| Utilities | 3 | $41B |
|
||
| Healthcare | 2 | $330B |
|
||
Price history
+0.0% since first listed3 events — show timeline
- 2026-05-11 Price Changed $269,999 Unlock MLS
- 2026-05-08 Price Changed $270,999 Unlock MLS
- 2026-04-22 Listed $269,999 Unlock MLS
Cash-flow waterfall
monthlySold comps — $/sqft
last 12 mo · ≤1 miLoading sold comps…